Animal Control Statistics - graph version
Text version of these statistics.
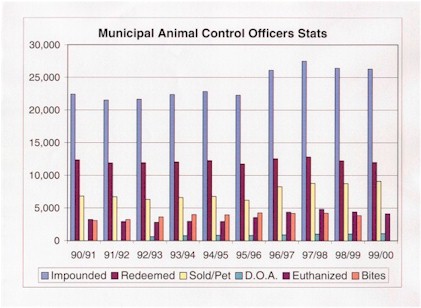
| Year | Complaints | Impounded | Redeemed | Sold/Pet | D.O.A. | Euthanized | Bites | Summons/ Infractions |
|---|---|---|---|---|---|---|---|---|
| 90/91 | 115,265 | 22,424 | 12,380 | 6,817 | N/A | 3,227 | 3,075 | 4,427 |
| 91/92 | 128,346 | 21,518 | 11,899 | 6,707 | N/A | 2,912 | 3,212 | 4,259 |
| 92/93 | 132,680 | 21,656 | 11,939 | 6,309 | 603 | 2,803 | 3,616 | 3,741 |
| 93/94 | 131,432 | 22,390 | 12,067 | 6,600 | 760 | 2,963 | 4,004 | 3,591 |
| 94/95 | 129,215 | 22,848 | 12,273 | 6,779 | 819 | 2,933 | 3,958 | 3,442 |
| 95/96 | 128,770 | 22,285 | 11,763 | 6,187 | 799 | 3,536 | 4,247 | 3,428 |
| 96/97 | 138,684 | 26,110 | 12,579 | 8,270 | 895 | 4,366 | 4,167 | 3,765 |
| 97/98 | 148,546 | 27,484 | 12,850 | 8,784 | 1,027 | 4,823 | 4,205 | 4,223 |
| 98/99 | 144,967 | 26,412 | 12,253 | 8,751 | 1,030 | 4,410 | 3,832 | 4,128 |
| 99/00 | 140,670 | 26,295 | 12,009 | 9,112 | 1,082 | 4,111 | 3,765 | 3,728 |
| 01/02 | 141,270 | 22,626 | 10,545 | 8,349 | 868 | 2,864 | 3,470 | 3,490 |
| 02/03 | 143,354 | 21,023 | 9,757 | 7,780 | 788 | 2,698 | 3,400 | 3,478 |
| 03/04 | 138,625 | 21,343 | 9,518 | 8,351 | 806 | 2,668 | 3,179 | 2,801 |
| 04/05 | 116,005 | 19,210 | 8,630 | 7,568 | 748 | 2,264 | 2,925 | 2,684 |
| 05/06 | 127,328 | 20,678 | 9,685 | 8,058 | 782 | 2,153 | 2,153 | 2,694 |
| 06/07 | 124,168 | 20,302 | 9,599 | 7,571 | 850 | 2,282 | 2,697 | 2,708 |