STD Statistics in Connecticut
Overall Summary:
Chlamydia, Gonorrhea and Syphilis by City (PDF): 2019
![]()
Click box to view.
|
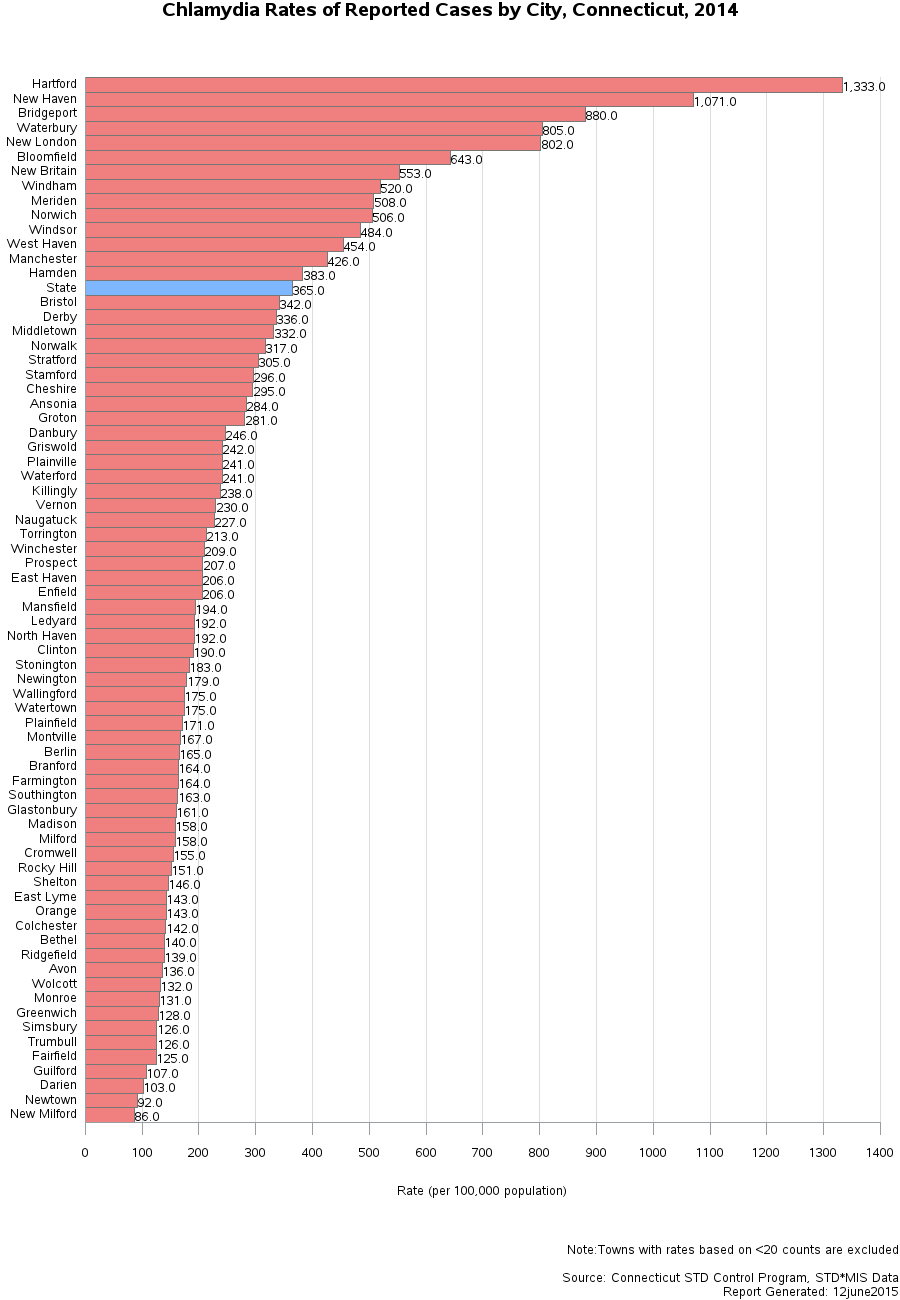
Chlamydia Rates by City, 2014
|
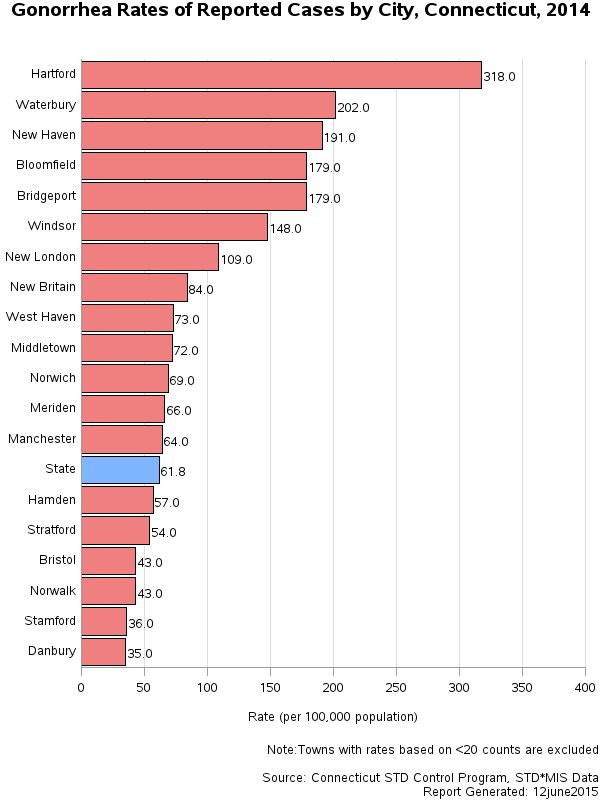
Gonorrhea Rates by City, 2014 |
 |
 |
Chlamydia, Gonorrhea and Syphilis by County (PDF)
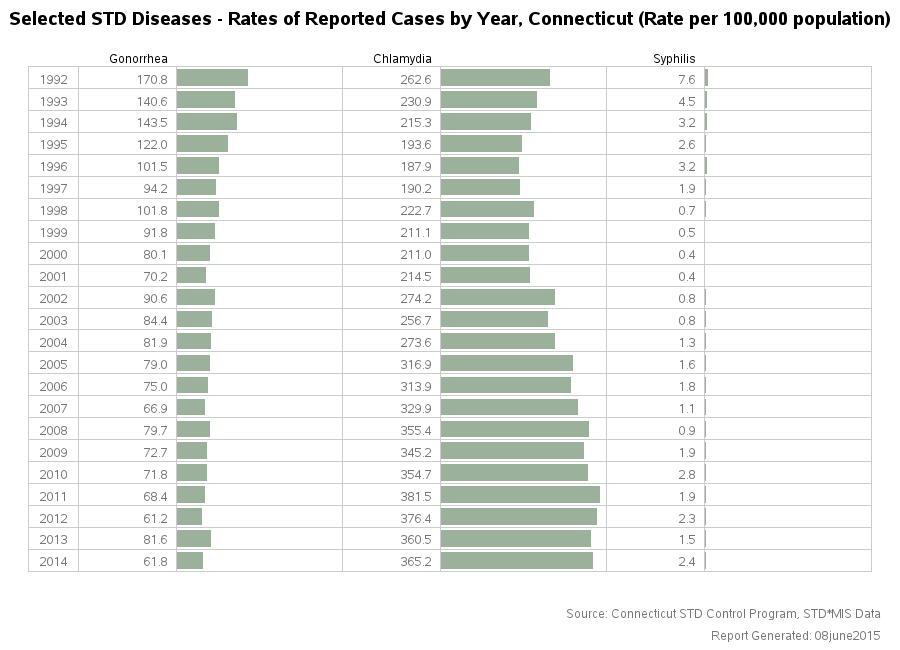
Chlamydia, Gonorrhea and Syphilis by Year of Diagnosis (PDF)
Chlamydia, Gonorrhea and Syphilis by Year of Diagnosis and Sex (PDF)
Chlamydia:
Chlamydia by Age, Race, and Sex (PDF)
Trend in Chlamydia by Select Cities (PDF)
Trend in Chlamydia by Race and Sex (PDF)
Trend in Chlamydia by Age (PDF)
Gonorrhea:
Gonorrhea by Age, Race and Sex (PDF)
Trend in Gonorrhea by Selected Cities (PDF)
Trend in Gonorrhea by Race and Sex (PDF)
Trend in Gonorrhea by Age (PDF)
Syphilis:
Trend in Syphilis by Race and Sex (PDF)
Trend in Syphilis by Age (PDF)
Please contact the STD Control Program for other data requests (860) 509-7920.
Other Links:
HIV/AIDS Surveillance Program Home Page