

Shore + Sound
Swimming, Clamming & Heavy Rain Plovers and Others
The Water of Long Island Sound Trends Under the (Rising) Surface


Trends Under the (Rising) Surface of Long Island Sound
The water is warming...
Fish species that thrive in cold water have become less common. Fishes from warmer regions are more common than they used to be.

______________
![]() The lobster population of Long Island Sound has failed to recover.
The lobster population of Long Island Sound has failed to recover.

![]()
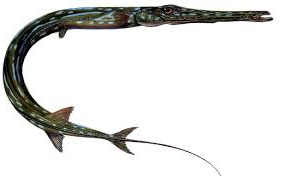
DEEP surveys marine fish, squid and lobster populations every spring and fall by towing nets from a research vessel. The top chart shows the average number of fish species caught in each tow during the spring and fall surveys combined. The well-documented trend toward species that favor warm water is apparent. The chart does not include the small but growing number of sub-tropical species captured in the fall tows. In 2014, the researchers netted their first Bluespotted Cornetfish (a skinny fish, depicted above), more commonly found in the tropics and sub-tropics. Data from 2010 are missing because no fall survey was conducted that year.
One study of 686 species, published in 2018, projects the shifts in thermal habitat for fish species all along the North American continental shelf. Water temperature is a major factor in determining the geographic distribution and preferred habitats of marine species. Future shifts in species distribution were generally found to be poleward and followed the coastline. It is shown in this study that climate change in the 21st century will shift the location and available area of suitable thermal habitat for species inhabiting the North American shelf. These results stress the importance of the level of global warming for the magnitude of changes in living marine resources by the end of this century.
The lower chart shows the number of lobster caught in the average tow during DEEP's fall survey of marine life. The numbers caught in 2016 and 2017 (most current data) were the lowest ever. The decline in the lobster population began in 1999. Throughout most of the 1990s (not shown on the chart), researchers generally caught between seven and eleven lobster per tow, with a spike to nearly 20 in 1997. From 2006 to 2014 commercial lobster landings in Connecticut declined dramatically (not shown); however, there was a slight increase in the commercial catch in 2015 and 2016. Researchers investigated several possible causes for the dramatic downturn in lobster populations since 1998 including disease, changes in water quality, changes in climatic conditions and other human impacts to the Sound such as the presence of insecticides. Scientists did not detect pesticides in lobsters collected in 2014, leaving the warming waters as the most likely problem for Connecticut's lobster.
As with finfish, there appears to be a shift northward over time of the lobster, which prefer a cold water habitat, as evident in the two illustrations below of the shift in the distribution of the Atlantic lobster catch. There is no "goal" for the lobster population but the "Quick Summary" box above presumes a decrease is not a desired trend.
Change in Lobster Catch Distribution 1990 vs. 2014

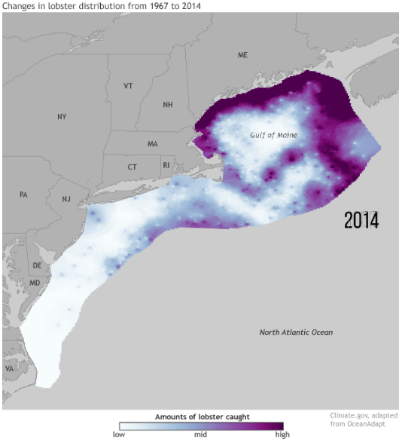
Source: NOAA, Climate.gov "Climate & Lobsters", Emily Greenhalgh, October 6, 2016
The average temperature of the water in Long Island Sound has been rising, with the surface temperature rising slightly faster than the bottom water. The frigid weather of early 2015 led to the coldest wintertime water temperature in at least 25 years; the weather and water then heated up more than usual in the summer. In 2017, the winter and summer water temperatures were well above average at the surface and at the bottom. Hypoxia is most likely to be a problem when water is warmer. The slightly lower average water temperature of 2018, compared to 2017 and most prior years, can be part of the reason that 2018 had less hypoxia than did 2017.
____________
...and rising.
The chart below displays average sea level from 1965 to the present at a monitoring station in Bridgeport, where sea level rise has accelerated since 1990.
![]() University of Connecticut scientists participated in a multi-year, multi-state assessment of bird species that nest in coastal marshes. The results, published in 2015, reveal several species in sharp decline. For Saltmarsh Sparrows and Clapper Rails, the declines of 10 to 13 percent annually since 1998 pose a risk of local extinction. From the report : "The declines can be explained by increases in rates of nest flooding since 2002." A scientific paper published in 2016 concludes that 1) for Saltmarsh Sparrows, the extinction will not just be local, but global, 2) extinction can only be averted through immediate conservation action, and 3) human influences on tidal flows are as big a factor as climate change.
University of Connecticut scientists participated in a multi-year, multi-state assessment of bird species that nest in coastal marshes. The results, published in 2015, reveal several species in sharp decline. For Saltmarsh Sparrows and Clapper Rails, the declines of 10 to 13 percent annually since 1998 pose a risk of local extinction. From the report : "The declines can be explained by increases in rates of nest flooding since 2002." A scientific paper published in 2016 concludes that 1) for Saltmarsh Sparrows, the extinction will not just be local, but global, 2) extinction can only be averted through immediate conservation action, and 3) human influences on tidal flows are as big a factor as climate change.
The Connecticut Institute for Resilience and Climate Adaptation (CIRCA) at the University of Connecticut projected a sea level change scenario of 0.5 m (1 foot 8 inches) higher than the national tidal datum in Long Island Sound by 2050. DEEP's Commissioner adopted CIRCA's recommended sea level change scenarios on December 26, 2018.
As the Sound rises, more tidal wetlands will be flooded. The natural "migration" of wetlands landward in response to sea level rise is prevented in many places by fill and development. There is no "goal" for coastal sea level, but the "Quick Summary" box above presumes this flooding is not a desired trend.
____________
The changes in marine life, temperature and sea level are signs of a warming Sound. The Long Island Sound Study is working on a "sentinel" monitoring strategy that will track changes in the Sound related to climate change. If successful, that strategy will help Connecticut residents understand the changes in the Sound more fully. In the meantime, change is ongoing and Connecticut will need to pay close attention, as gradual change can become sudden change.
Technical Notes:
1. The cold-adapted species (numbering 33) shown on the top chart are those that prefer water temperatures below 60 degrees Fahrenheit. The warmer-adapted species (numbering 38) prefer water ranging from 50 to 72 degrees Fahrenheit. Many factors affect the number of species in the Sound and their abundance, and although the composition of the finfish community is changing in favor of species tolerant of warming temperatures, the overall diversity in the Sound remains high. 2010 was excluded from the chart because no survey was conducted during the fall of that year.
2. Lobster data for 2010 are absent because repairs to the research vessel John Dempsey precluded the fall Long Island Sound trawl survey.
3. The bottom chart shows the average level of the Sound at a point in Bridgeport, expressed as the number of feet above a submerged reference point.
*The term "detailed view" on the bottom chart refers to the fact that the vertical axis has been shortened, beginning at five (feet) rather than the customary zero. This detailed view allows the reader to discern changes in the rate of sea level rise across decades.