
Air Quality Summary and Trends
Air Quality Summaries and Trends
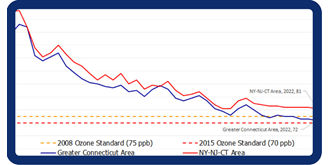
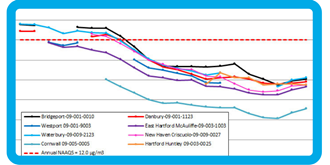
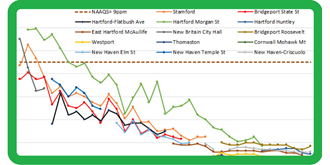
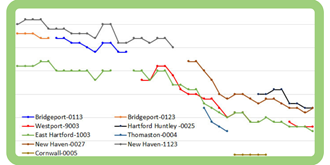
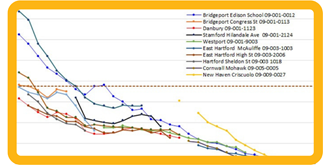
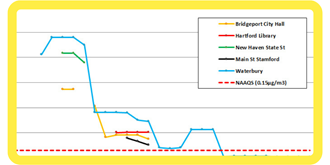
Graphs of air quality trends can be used to compare historical air quality to modern air quality and to determine if control and abatement strategies have been effective. The six pollutants listed are considered "criteria" pollutants and have National Ambient Air Quality Standards (NAAQS) set by the EPA Office of Air Quality Planning and Standards (OAQPS).
The below air quality plots show the relative trends through the latest year available. Click the graph thumbnails below to view larger versions and additional information.
Additionally, the EPA annual air quality summary reports can be found in the following link: Annual Air Quality Summary.
Content last updated on May 22nd, 2023