

Press Releases

08/28/2023
Connecticut Sees Improvement in Attendance, and Math and Science Scores
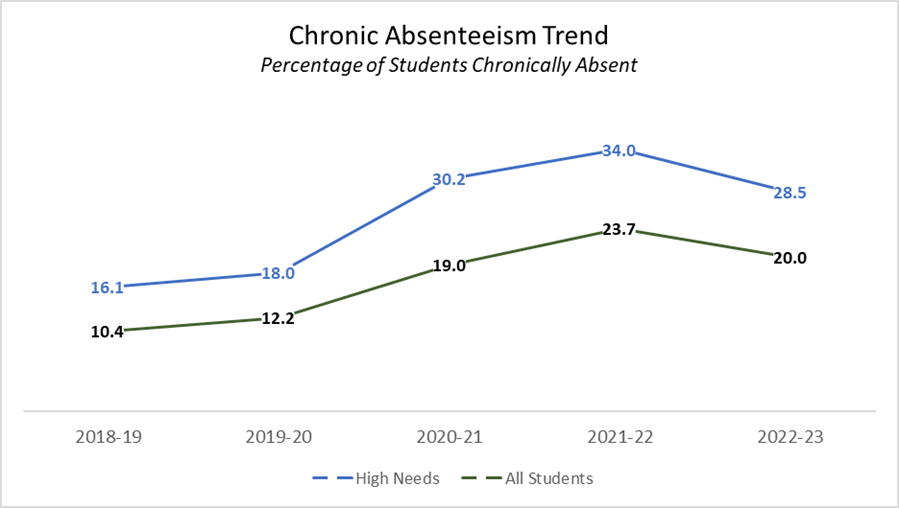
(Hartford, CT) - Today, the Connecticut State Department of Education (CSDE) is releasing chronic absenteeism data from 2022-23 along with results from the spring 2023 state assessments [i]. The data show that for the first time since the pandemic, attendance improved, and chronic absenteeism rates declined from 23.7 percent in 2021-22 to 20.0 percent in 2022-23 resulting in approximately 18,000 more students attending school regularly in 2022-23. Improvements were evidenced in all grades and in all student groups.
Attendance is an essential pre-requisite for learning. The CSDE’s Performance Index[ii] is the best measure of overall average achievement across standard and alternate assessments in a content area. The results show that there have been improvements in student achievement in mathematics and science but improvement in English language arts (ELA) is mixed.

"The improvements in chronic absenteeism, as well as math and science scores should encourage us to strengthen our collective resolve and continue working together intensively to re-engage all students in their education,” said Commissioner Charlene Russell-Tucker. “It is incumbent upon all of us to use these and other data to effectively foster innovation and create learning environments that empower students to realize their infinite possibilities and boundless potential.”
Nationwide, absenteeism rates spiked during the pandemic. In his recent paper titled Higher Chronic Absenteeism Threatens Academic Recovery from the COVID-19 Pandemic, Dr. Thomas Dee of Stanford University analyzed data from several states to show that chronic absenteeism “grew substantially as students returned to in-person instruction. Specifically, between the 2018-19 and 2021-22 school years, the share of students chronically absent grew by 13.5 percentage points.” This pattern was also seen in Connecticut where chronic absenteeism rates increased from 10.4 percent in 2018-19 to 19.0 percent in 2020-21 and to 23.7 percent in 2021-22 after the return to full-time in-person learning. Over the last decade, and especially through the pandemic, the CSDE has received national recognition for its leadership, policy, support initiatives, and data transparency around attendance. It is therefore encouraging to see that in 2022-23, for the first time since the pandemic, chronic absenteeism rates declined by 3.7 percentage points to 20.0 percent. While still unacceptably high, this decline is hopefully the beginning of a new trend that also bolsters an academic recovery.
With regard to mathematics achievement, increases were evidenced in most grades and student groups while science achievement improved in two of the three grades and in some student groups. At the district level, more are meeting or exceeding their pre-pandemic achievement levels. In 2022-23, 44 districts in mathematics and 65 districts in science met or exceeded their pre-pandemic levels, up from 23 and 48 districts respectively in 2021-22. Statewide performance still lags pre-pandemic levels in all areas and for all student groups and grades.
|
|
English Language Arts |
Mathematics |
Science |
||||||
|---|---|---|---|---|---|---|---|---|---|
|
Student Group |
2019 |
2022 |
2023 |
2019 |
2022 |
2023 |
2019 |
2022 |
2023 |
|
All Students |
67.7 |
64.2 |
63.9 |
63.1 |
58.6 |
59.7 |
63.8 |
61.4 |
61.6 |
|
High Needs (F/R, EL or SWD) |
58.1 |
54.2 |
54.1 |
52.7 |
47.7 |
48.9 |
54.2 |
51.3 |
51.1 |
|
Grade 3 |
69.9 |
66.2 |
65.8 |
64.9 |
60.5 |
62.1 |
n/a |
n/a |
n/a |
|
Grade 4 |
72.0 |
68.9 |
69.2 |
68.4 |
64.1 |
65.6 |
n/a |
n/a |
n/a |
|
Grade 5 |
69.6 |
66.5 |
66.4 |
67.3 |
62.8 |
64.4 |
67.6 |
65.8 |
65.9 |
|
Grade 6 |
70.3 |
66.6 |
66.7 |
63.5 |
58.4 |
59.7 |
n/a |
n/a |
n/a |
|
Grade 7 |
68.4 |
64.2 |
64.0 |
62.1 |
57.4 |
58.3 |
n/a |
n/a |
n/a |
|
Grade 8 |
65.7 |
61.9 |
61.6 |
60.4 |
55.0 |
56.1 |
64.5 |
61.7 |
61.0 |
|
Grade 11 |
57.7 |
55.3 |
53.9 |
55.0 |
52.4 |
51.9 |
59.1 |
56.6 |
57.9 |
|
Eligible For Free/Reduced Price Meals |
58.5 |
54.4 |
54.2 |
52.7 |
47.3 |
48.5 |
54.3 |
51.4 |
51.1 |
|
Students with Disabilities |
47.4 |
45.0 |
45.3 |
41.7 |
38.8 |
40.1 |
46.6 |
44.0 |
43.5 |
|
English Learners |
55.0 |
51.2 |
50.9 |
51.7 |
46.8 |
47.8 |
51.4 |
48.6 |
47.5 |
|
American Indian or Alaska Native |
62.3 |
58.4 |
57.3 |
57.5 |
53.0 |
52.1 |
58.2 |
55.5 |
56.3 |
|
Asian |
79.5 |
77.5 |
77.1 |
79.8 |
76.6 |
77.7 |
76.3 |
75.5 |
76.6 |
|
Black or African American |
56.8 |
53.5 |
53.3 |
49.7 |
44.9 |
45.8 |
50.8 |
48.7 |
48.3 |
|
Hispanic or Latino |
58.1 |
54.4 |
54.1 |
52.4 |
47.6 |
48.8 |
53.8 |
51.3 |
50.9 |
|
Native Hawaiian/Other Pacific Islander |
66.2 |
62.5 |
60.5 |
62.8 |
57.6 |
56.5 |
64.2 |
58.9 |
59.3 |
|
Two or More Races |
70.0 |
67.0 |
66.7 |
65.0 |
60.9 |
62.1 |
66.1 |
64.0 |
64.8 |
|
White |
73.6 |
71.0 |
70.9 |
69.6 |
66.4 |
67.7 |
69.9 |
68.3 |
69.3 |
A closer look at the standard assessments reveals the following:
- Proficiency[iii] rates on Smarter Balanced in Grades 3-8 trail pre-pandemic levels by about 6 to 9 percentage points in ELA and about 4 to 7 percentage points in mathematics.
- Average scale scores on the CT SAT School Day are about 20 points lower today than prior to the pandemic.
- On the Next Generation Science Standards (NGSS) assessments, proficiency lags pre-pandemic levels by 1 to 3 points in Grades 5 and 11, and nearly 5 points in Grade 8.
A leading indicator of student achievement is academic growth on the Smarter Balanced in Grades 4 through 8. It measures the pace of student learning in a school year. While the 2021-22 results showed stronger academic growth in most grades and subjects than in pre-pandemic years, that rate of growth slowed in 2022-23. There is tremendous variation in academic growth across districts and schools. Though students statewide are achieving around 60 percent of their growth targets on average, some high growth districts and schools consistently demonstrate growth that is 20+ points higher. Some of the factors contributing to academic growth in Connecticut’s high growth schools and districts include: climate, culture, and social and emotional supports for students and teachers; targeted and focused improvement of curriculum and instruction; data-based decision making; responsive and effective professional learning; personalized learning; and district-wide coherence. A new research study on academic recovery that is currently being conducted by Connecticut higher education faculty through the Center for Connecticut Education Research Collaboration (CCERC) will further explore the practices and approaches that have been successful at supporting academic recovery from the pandemic, particularly for our students with high needs.
To track academic recovery, the CSDE created a Pandemic Recovery dashboard on EdSight (see screenshot below). This dashboard compares how the Performance Index in 2021-22 and 2022-23 changed from 2018-19. These data are presented for all districts, schools, and student groups to show where there are signs of learning acceleration and recovery.

The CSDE in collaboration with many partners including district, school, and community leaders is working with a sense of urgency to support critical work, provide resources, and identify successful strategies. Recent projects include the following:
- Connecticut has continued its investment in the nationally recognized Governor’s Learner Engagement and Attendance Program (LEAP) that has been shown to increase student attendance in middle and high school by 20 percentage points on average. LEAP provides direct engagement and targeted assistance to families and students through supportive targeted home visits. There are currently 14 districts funded to participate in LEAP, and virtual LEAP 101 training is being accessed by many non-LEAP districts as well.
- Dedicated school mental health professionals are an important component of ensuring students are getting the support they need. Several initiatives supported by federal ARPA funding through the Governor and Connecticut General Assembly are underway:
- The School Mental Health workers Grant provides $5 million in funding under a competitive state grant program to 20 districts for hiring and maintaining school mental health workers during the 2023, 2024, and 2025 school years.
- The School Mental Health specialists grant provides $15 million in funding for 72 school districts to support the hiring and retention of school mental health specialists for the 2024, 2025, and 2026 school years.
- The summer mental health grant provides $4.5 million in funding for 48 school districts and summer camp programs to support the delivery of mental health services for students during the summer months over a three-year period.
- The Connecticut Behavioral Health Pilot in select districts is ensuring that they have a coordinated and sustainable system of care for all K-12 schools to provide comprehensive behavioral and mental health supports and services to students and staff.
- To assist districts in implementing high quality, high impact curricula, in Summer 2023, the CSDE launched its third phase of Connecticut Model Math Curricula by releasing Grades K-2 Model Math with financial literacy tasks. The earlier phases included Grades 3-5 Model Math Curricula and Grades 6-8 Model Math Curricula, as well as publisher alignment guides. Additionally, the second phase of Connecticut Model Science Curricula is available and includes the release of the grades 3-5 Model Science units of study with identified science and engineering practices, crosscutting concepts, and example phenomena. All model curricula are available through GoOpenCT, Connecticut's open education resource digital library.
- The Science of Reading (SOR) Masterclass began its third cohort of districts in Summer 2023. In the first two cohorts, 24 districts developed local professional capacity through this Masterclass to implement evidence-based reading aligned to the science of reading components including phonics, phonemic awareness, fluency, vocabulary, and comprehension.
- The CSDE has invested $7.2 million to assist children and youth experiencing homelessness. Grant funding has been provided to districts and schools to identify children and youth experiencing homelessness and to provide academic, social-emotional, and mental and behavioral health supports to ensure that they can participate fully in school. Additionally, in February 2023, the CSDE launched its “No Matter What” campaign to highlight resources available for students experiencing homelessness and housing instability.
- After-school programs foster students’ social, emotional, and academic growth. The CSDE awarded $8.7 million in ARP ESSER funding to 45 programs across Connecticut to expand and enhance after-school offerings.
- The CSDE is continuing its support for summer enrichment programs by investing an additional $11.5 million of federal ARPA funds through the Governor and Connecticut General Assembly in 110 programs for 2023 and 2024. Summer enrichment is designed to keep students engaged in learning during the summer months, so they are ready for new learning when the school year begins.
- In June 2023, the CSDE launched a competitive district application for High-Dosage Tutoring (HDT) in Grades 6-9 Mathematics. HDT is a well-researched strategy to address learning loss, ensuring students have intensive, curriculum-aligned support to close academic gaps. Applications are due September 1 and implementation will begin in January 2024.
- Connecticut continues to evaluate the effectiveness of its investments through its research partnership with institutions of higher education across Connecticut. CCERC has released evaluation studies on LEAP, summer enrichment, and remote learning. Nine additional projects are underway. Since many of the projects require an in-depth review of local policies and practices, the research would not be possible without the cooperation of our district partners.
- To provide parents of children with disabilities with timely information and resources related to special education laws and the rights and protections of students receiving special education services, the CSDE opened a new Special Education Call Center. The call center can be accessed in English and Spanish by dialing 860-713-6966. Regular business hours are Monday-Friday (excluding holidays) 8:30 a.m.-4:30 p.m.
Links to all attendance and assessment related EdSight reports are listed below.
- Chronic Absenteeism (ct.gov)
- Performance Index (ct.gov)
- Pandemic Recovery Dashboard
- Smarter Balanced Achievement/Participation (ct.gov)
- Smarter Balanced Growth Model (ct.gov)
- Smarter Balanced Rough Cohort Dashboard (ct.gov)
- Next Generation Science Standards (NGSS) Assessment (ct.gov)
- Connecticut School Day SAT
###
For Immediate Release: August 28, 2023
CSDE Contact: Eric Scoville, Director of Communications
Email: Eric.Scoville@ct.gov
[i] These include the Smarter Balanced assessments in ELA and Math in Grades 3-8, the Connecticut SAT School Day in ELA and Math in Grade 11, the Connecticut Alternate Assessment for students with significant cognitive disabilities in Grades 3-8 and 11, the Next Generation Science Standards (NGSS) assessments in Grades 5, 8, and 11, and the Connecticut Alternate Science assessment for students with significant cognitive disabilities in Grades 5, 8, and 11.
[ii] Since students take different assessments in each subject, the Performance Index is the best measure of overall aggregate student achievement. This index is the average student achievement on all state academic assessments across all tested grades (3-8 and 11) combined. A separate index is produced for each tested subject: English language arts (ELA), mathematics, and science. The index ranges from 0 to 100. The state target for the Performance Index is 75. At an index of 75, students, on average, are performing solidly in the desired achievement level on their respective assessment. The Performance Index is a key component of Connecticut’s Next Generation Accountability System.
[iii] Proficiency rate – or the percentage of students who achieve at or above level 3 – is a commonly used approach to represent aggregate achievement. Researchers, however, strongly caution against reliance on this measure because of its reliability issues, and its harmful, unintended consequences (e.g., overreliance on the “percent proficient” metric encourages educators to focus solely on “bubble” students just below the proficiency standard). Researchers recommend use of the student scale score instead of the performance level for determining average performance for all students and student groups. The CSDE Performance Index is based on the student scale score.
- Twitter: CT State Department of Education Twitter
- Facebook: CT State Department of Education Facebook