
Ozone Trends
Air Quality Trends - Ozone
Air quality trends are used to assess if the air quality is improving and thereby determine if control and abatement strategies are effective. These air quality plots below show the relative trends over time and are updated on a yearly basis. LISTOS Study of Ozone Chemistry Around Long Island Sound Ozone • PM2.5 • Carbon Monoxide • Nitrogen Dioxide • Sulfur Dioxide • Lead
Please select for a PDF version of the ozone trends plot
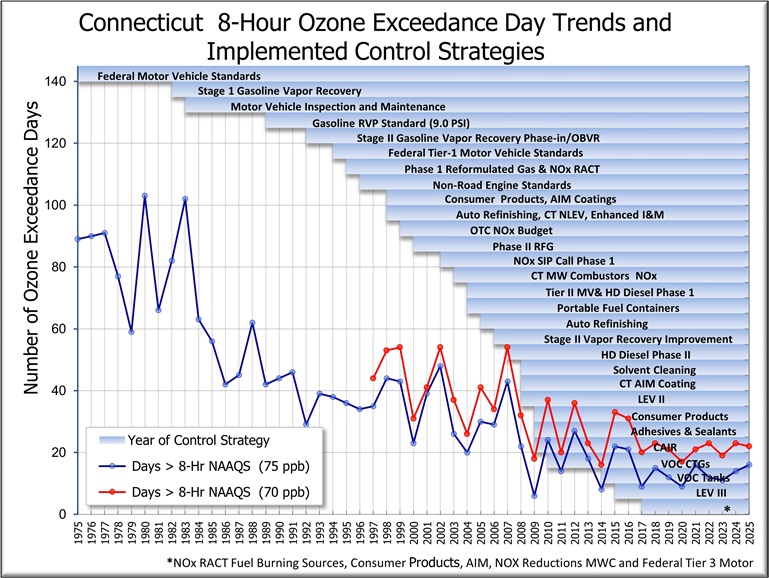
In 2015, the United States Environmental Protection Agency (EPA) adopted a more stringent ambient air quality health standard for ozone of 70 parts per billion (ppb), averaged over an 8-hour period. The prior standard of 75 ppb remains in effect and Connecticut has not yet achieved compliance with either standard. Compliance with standards set prior to 2008 have been achieved. The above figure shows that the number of days that Connecticut has exceeded either standard since 1975 has declined considerably. During the early 1980's, Connecticut experienced more than 100 days with ozone levels exceeding the most recent standards. In more recent years, Connecticut has recorded around 20 exceedance days per year. This overall improvement in air quality is due to the implementation of a number of emission reduction programs aimed at automobiles, fuels and stationary sources. The timing of some of these programs is shown on the above figure.
Ozone design values are calculated annually at each monitoring site. This is done by taking the 4th highest maximum daily 8-hour ozone average from each year and then averaging these from the past three years. This method is used to lessen the influence of extreme weather events for any one year, such as heat waves and stagnation. If the design value does not exceed the 8-hour standard (70 ppb), then the monitor has attained the standard. The figure below shows the downward trends of the 8-hour ozone design values for all the Connecticut monitoring sites each year since 1983. There are a few monitors that are attaining the current 70 ppb standard and the Greater Connecticut monitors are just attaining the previous 75 ppb standard.
Please select for a map of the Connecticut non-attainment ozone areas (pdf)

Please select for a PDF version of the ozone design value plot
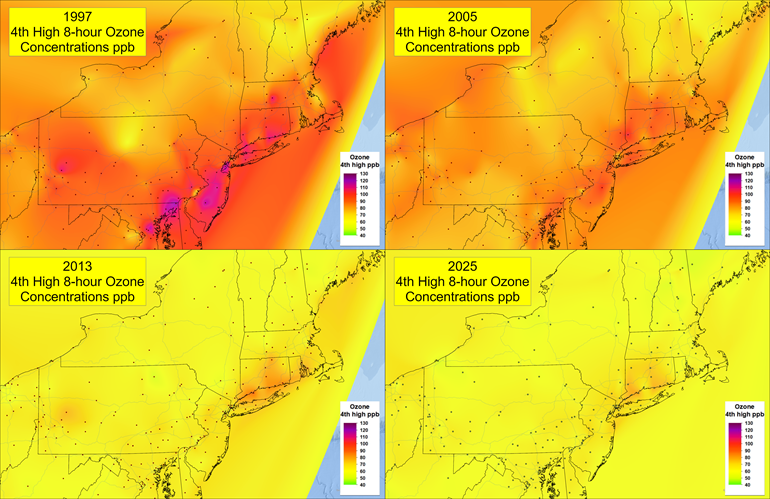
The panel below shows color contoured images of preliminary 4th high daily 8-hour ozone averages for 1997 (top left), 2005 (top right), 2013 (bottom left), and 2025 (bottom right) including all the ozone monitors in the northeast States. This panel shows a dramatic improvement of the ozone levels in the region since 1997.
Please select for a PDF version of the 4th High Ozone Concentrations Panel
High ozone concentrations typically occur on hot summer days with winds from the southwest at the surface and from the west at higher altitudes. These weather conditions transport ozone precursors from the large metropolitan areas of the Mid-Atlantic, especially from the New York City area, often at levels that exceed the health standard at Connecticut's upwind boundaries. Emissions from transportation, industrial and commercial sources in Connecticut then further enhance the production of ground-level ozone in Connecticut.
Content Last Updated June 18, 2026