
Fine Particle Trends
Air Quality Trends - PM2.5
Ozone • PM2.5 • Carbon Monoxide • Nitrogen Dioxide • Sulfur Dioxide • Lead
Air quality trends are used to assess if the air quality is improving and thereby determine if control and abatement strategies are effective. The trends of Connecticut's PM2.5 monitoring sites since 2001 are displayed below.
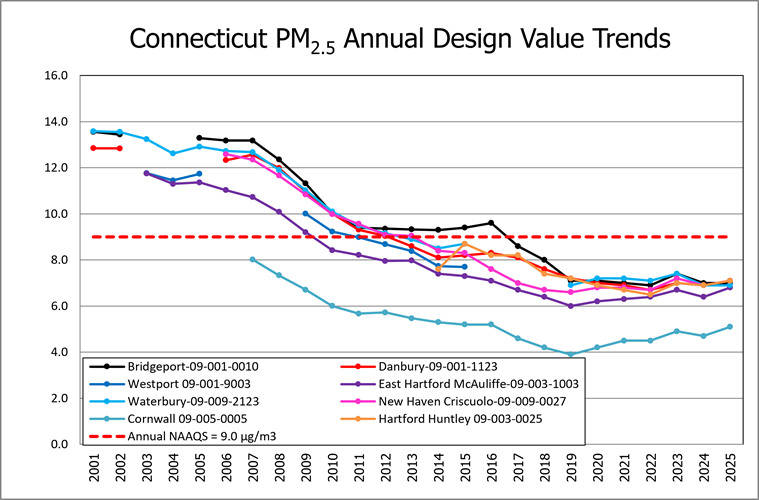
The above graph displays Connecticut’s trend of the annual PM2.5 design values and the National Ambient Air Quality Standard (NAAQS) of 9.0 µg/m3. The annual design value for each monitor is calculated by taking the three-year average annual mean concentration (40 CFR Part 50 Appendix N). All monitors are currently meeting the annual PM2.5 NAAQS.
Below is the trend of Connecticut’s 24-hour design values and the NAAQS of 35 µg/m3. The 24-hour average is defined as the three-year average of the 98th percentile of the 24-hour samples (40 CFR Part 50 Appendix N). All monitors are also currently meeting the 24-hour PM2.5 NAAQS.

Please select for a larger view of the PM2.5 24 Hour Design Values Chart
Content Last Updated on July 8, 2026