


Press Releases

04/10/2017
Gov. Malloy Announces Statewide Graduation Rates Increase for Sixth Year in a Row, Reach Record High
Highest Need Districts Improving at Faster Rate than State Average
(HARTFORD, CT) – Governor Dannel P. Malloy and State Department of Education (SDE) Commissioner Dianna Wentzell today announced that graduation rates in the state reached an all-time high during the 2016 school year, hitting 87.4 percent, and that graduation gaps continue to close. Connecticut students continue to graduate high school within four years at a significantly higher rate than the national average of 83.2 percent.
Also on the rise is the graduate rate for schools that participate in Connecticut’s Alliance District program. The graduation rates for the Alliance District schools reached 78.3 percent in 2016, up from 71.2 percent in 2011. The state’s ten highest-need Opportunity District schools saw an even more dramatic increase over the past six years of over nine points, up to 73.0 percent in 2016.
“Connecticut is graduating more students than ever before and sending bright, talented young people into the world to make a big impact,” Governor Malloy said. “I could not be more proud of our hard-working students – the future is bright for our state. We need to continue making progress for all students, and that means keeping a laser-sharp focus on preparing all children for success in college and the workforce.”
“The fact that Connecticut’s graduation rate continues to rise means we are moving closer to our goal of ensuring every student has the tools and knowledge to succeed in college, career, and life,” Commissioner Wentzell said. “I am inspired by the hard work and dedication our students invest in their education, and I look forward to following their future successes. I also want to congratulate our teachers, principals, superintendents, parents, and community partners for helping Connecticut students succeed and prepare for the challenges beyond high school.”
|
Four-Year Graduation Rate |
|||||||
|
|
2011 |
2012 |
2013 |
2014 |
2015 |
2016 |
Difference from 2011 |
|
Opportunity Districts (10) |
63.6% |
66.3% |
69.1% |
71.7% |
71.6% |
73.0% |
9.4 |
|
Alliance Districts (30) |
71.2% |
73.5% |
74.8% |
77.5% |
77.6% |
78.3% |
7.1 |
|
Statewide |
82.7% |
84.8% |
85.5% |
87.0% |
87.2% |
87.4% |
4.7 |
Through the Alliance District program, the state provides increased funding tied to greater accountability for the 30 lowest performing school districts.
The Opportunity Districts, a subset of the Alliance Districts and among the ten lowest performing in the state, showed a 9.4-point gain since 2011. New Haven Public Schools, an Opportunity District, increased 13.6 points since 2011, reaching 77.5 percent in 2016.
Governor Malloy and Commissioner Wentzell made the announcement today during a news conference at Hillhouse High School in New Haven, which had the second largest rate of increase in graduation rate over the past five years of any Connecticut high school, reaching 80.4 percent in 2016, up from 54.9 percent in 2012.
“We’re pleased with results in New Haven to help more high school students overcome academic challenges and graduate – I credit both teachers and students for a continuing, positive trend in this regard,” Mayor Toni N. Harp said. “New Haven’s comprehensive approach curbs chronic absenteeism and provides wraparound student services to see more of those enrolled walk across the stage with a well-deserved diploma.”
“High school graduation is an important accomplishment that opens the door to great possibilities for the future,” New Haven Superintendent of Schools Reginald Mayo said. “New Haven is so proud of our rising graduation rate because it means that more and more students are entering the world ready to take on important challenges in college and the workforce. I thank Governor Malloy, Mayor Harp, and all of the educators, parents and partners who help New Haven students succeed.”
In 2016, a subgroup of high-needs students – which includes English learners, those eligible for free or reduced price lunch, and students receiving special education services – saw another increase in the graduation rate to 76.8 percent. Over the past six years, the graduation rate for high-needs students has jumped 11.9 points, closing the graduation gap by 24 percent.
|
State of Connecticut Trend Graduation Cohort by High Needs Four-Year Graduation Rate by Year |
||||||
|
|
2010-11 |
2011-12 |
2012-13 |
2013-14 |
2014-15 |
2015-16 |
|
High Needs |
64.9 |
71.4 |
72.4 |
75.5 |
76.1 |
76.8 |
|
Non-High Needs |
92.4 |
95.9 |
96.5 |
97.1 |
97.6 |
97.6 |
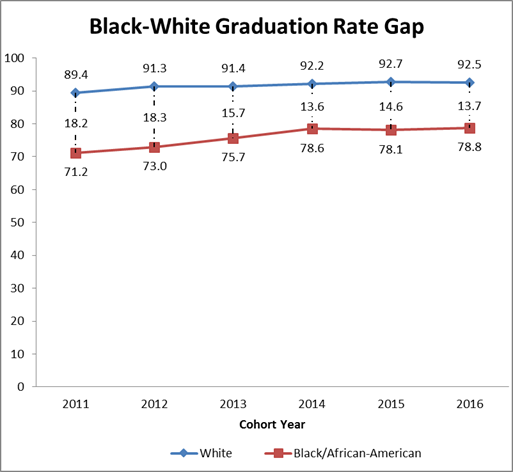
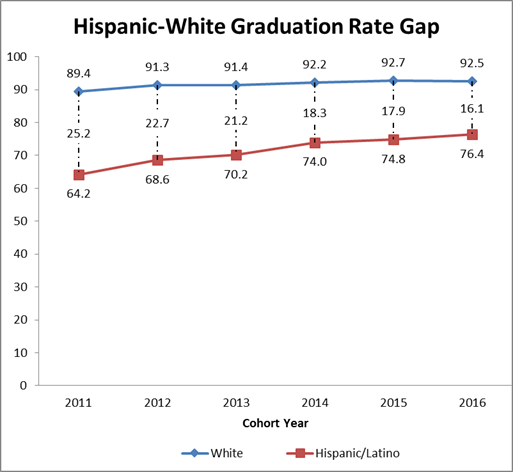
Also, graduation rates for black and Hispanic students continued to increase, outpacing the average growth for the state. The graduation rate for black students reached 78.8 percent in 2016, up 7.6 points since 2011. For Hispanic students, the graduation rate reached 76.4 percent in 2016, up 12.2 points since 2011.
English learners also have improved since 2011, increasing 7.9 points to 67.3 percent. The graduation rate for students with disabilities is 65.2 percent, up only 2.8 points since 2011 and down slightly from the previous year. It should be noted that English learners and students who receive special education have the highest “still enrolled rate,” a sign that they are continuing their pursuit of a high school diploma. It is precisely for this reason that Connecticut incorporated the six-year graduation rate into its accountability system as an important additional measure of high school success.
“Our commitment to equity and excellence in Connecticut schools means doing everything in our power to create the right conditions for all of our students to succeed. We recognize and commit to the need to accelerate the pace of improvement for our students who face the biggest challenges,” Commissioner Wentzell explained.
Graduation rates are calculated according to the Adjusted Cohort Graduation Rate method, which the National Governors Association developed and is considered to be most precise. These rates represent the percentage of first-time ninth-grade students who graduated with a regular high school diploma in four years or less. It is based on individual student-level data, excludes ninth-grade repeaters, late graduates, and accounts for transfers in and out of the graduating class over the four-year period.
|
Connecticut 2016 Cohort Graduation Rate |
|||||
|
|
Graduates |
Non-Graduates |
|||
|
Category |
2016 Cohort Count |
4-Year Graduation Rate |
Difference from 2015 |
Still Enrolled |
Other |
|
All Students |
42,578 |
87.4 |
0.2 |
5.4 |
7.1 |
|
Hispanic |
8,614 |
76.4 |
1.7 |
8.5 |
14.9 |
|
Non-Hispanic |
33,964 |
90.2 |
0.0 |
4.6 |
5.1 |
|
Indian or Alaska Native |
136 |
89.0 |
1.9 |
1.5 |
9.6 |
|
Asian |
1,816 |
94.6 |
-0.2 |
3.0 |
2.3 |
|
Black |
5,682 |
78.8 |
0.7 |
9.7 |
11.3 |
|
Hawaiian or Pacific Islander |
37 |
83.8 |
11.8 |
5.4 |
10.8 |
|
White |
25,496 |
92.5 |
-0.2 |
3.6 |
3.8 |
|
Two or More Races |
797 |
87.7 |
1.0 |
4.0 |
8.3 |
|
Male |
21,872 |
84.3 |
-0.1 |
7.0 |
8.5 |
|
Female |
20,706 |
90.6 |
0.5 |
3.7 |
5.6 |
|
English Learner |
2,258 |
67.3 |
0.6 |
12.9 |
19.6 |
|
Non-English Learner |
40,320 |
88.5 |
0.2 |
5.0 |
6.4 |
|
Eligible for Lunch |
17,854 |
76.7 |
0.8 |
9.1 |
14 |
|
Eligible for Free Lunch |
14,763 |
74.4 |
1.1 |
9.9 |
15.6 |
|
Eligible for Reduced Lunch |
3,091 |
88.0 |
0.2 |
5.4 |
6.4 |
|
Not Eligible for Lunch |
24,724 |
95.1 |
-0.2 |
2.7 |
2.2 |
|
Special Education |
6,336 |
65.2 |
-0.4 |
21.5 |
12.8 |
|
Non-Special Education |
36,242 |
91.3 |
0.5 |
2.6 |
6.1 |
|
High Needs |
20,913 |
76.8 |
0.7 |
10.3 |
12.7 |
|
Non-High Needs |
21,665 |
97.6 |
0.0 |
0.7 |
1.7 |
Source: Public School Information System
Notes:
- With the exception of the 2016 cohort count column, which is a count of students, all remaining columns represent percentages. Row percentages may not add up to 100 percent because of rounding.
- A student is included in the EL, special education, or free/reduced lunch subgroup, or any combination of them, if he or she was reported in that subgroup in at least one of the Public School Information System data collections over the course of his or her high school career.
- In reporting race/ethnicity, the student's last reported category is used.
- Special Education students who are still in school after four years but have earned the academic credits to graduate are included in the “still enrolled” column for this calculation.
- The Cohort Count is as of the end of the 2015-16 school year.
- Four-Year Graduation Rate is the percentage of students who received a standard diploma within four years including early and summer graduates from the cohort.
- Still Enrolled means students were still in school after four years.
- Other category includes students who dropped out (including those who enrolled in an adult education program), or transferred to postsecondary education, or transferred to another school district but never enrolled in that district, or have an unknown status.
Graduation Rate Gaps Among Student Groups
Since 2011, the graduation rate gap between black and white students closed by nearly 25 percent. It went from a 18.2 percentage point differential in 2011 to a 13.7 percentage point gap in 2016 – decreasing by a total 4.5 percentage points over that time.
Since 2011, the graduation rate gap between Hispanic and white students closed by 36 percent. It went from a 25.2 percentage point differential in 2011 to a 16.1 percentage point gap in 2016 – decreasing by a total 9.1 percentage points over that time.
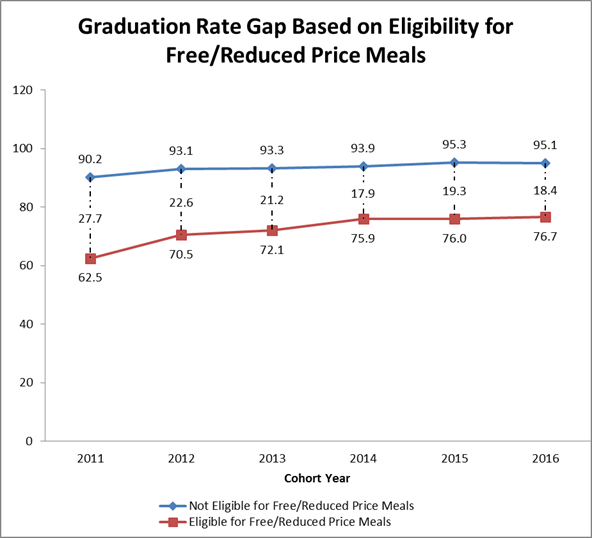
Using free and reduced-priced meal eligibility as an indicator of family wealth, the graduation rate gap between free and reduced-priced eligible students and non-eligible students closed by nearly 34 percent since 2011. It went from a 27.7 percentage point differential in 2011 to an 18.4 percentage point gap in 2016 – decreasing by a total 9.3 percentage points over that time.
While the increases among the graduation rates for students from subgroups are encouraging, significant gaps remain. Specifically, among black students and Hispanic students eligible for free lunch, there are substantial differences in graduation rates between males and females.
Methodology and Documentation
SDE introduced the four-year cohort graduation rate with the graduating class of 2009. This approach was created when Connecticut and 49 other states signed an agreement with the National Governors Association to develop a uniform system for tracking students. The four-year cohort graduation rate is calculated by tracking an individual cohort, or group of students, from their initial entrance into Grade 9 through to graduation. The four-year cohort graduation rate represents the percentage of students who earn a standard high school diploma within four years. The calculation uses individual student-level data from the state’s Public School Information System (PSIS) that school districts submitted and superintendents certified.
**Download: Complete documentation regarding the SDE four-year cohort graduation rate- Twitter: @GovMalloyOffice
- Facebook: Office of Governor Dannel P. Malloy