


Press Releases

GOV. MALLOY: GRADUATION RATE INCREASES FOR FOURTH CONSECUTIVE YEAR
Students of Color and Economically Disadvantaged Students Outpace State Increase

Since 2010, the black-white gap in graduation rates reduced by 4.3 percentage points (21.5 percent) and the Hispanic-white gap reduced by 3.5 percentage points (14 percent). Over the same time, the graduation gap between economically disadvantaged students and their more affluent peers reduced by 4.5 percentage points (17.5 percent).
"Four consecutive years of increases in the graduation rate is a great thing, one for which all of our teachers should be proud," said Governor Malloy. "This combined with the first-ever narrowing of our reading achievement gap is proof that when we invest in our children and our educators, we will achieve success. While we still have work to do, this is a clear sign that by equipping our schools and districts with additional resources, we are moving in the right direction."
The statewide average increased by 0.7 percent in 2013 as compared to 2012, representing a cumulative increase of 3.7 percent over the 2010 graduation rate.
In 2013, black, Hispanic, and free-lunch-eligible students substantially outpaced the statewide average increase at 2.7 percent, 1.6 percent, and 2 percent, respectively. The 2013 graduation rate for students in the Alliance Districts, 30 of the state's lowest performing districts, is up by 1.3 percent. The Educational Reform Districts[1], a subset of the Alliance Districts and among the 10 lowest performing in the state, showed the greatest gains with a 2.8 percentage-point increase - from 66.3 percent in 2012 to 69.1 percent in 2013.
"By focusing on our highest-need districts and partnering with our system's stakeholders, we are closing Connecticut's graduation gap and increasing our overall graduation rate," Commissioner Pryor said. "It's critical that we enable more of our young people to complete high school - and to do so prepared for college, career, and life. When combined with our recent first-rate results on the national 12th-grade assessments, this increase in the graduation rate is a clear sign that our schools are making real progress. We thank our state's teachers, administrators, parents and students for collaborating so successfully and making such strides. While we are proud of this accomplishment, we cannot rest on our laurels. Our graduation gaps are still too wide and much more work remains to be done. We must continue to work together in order to provide all our students, regardless of zip code or family wealth, with an education that readies them for lifelong success."
Through the Alliance District program, the state provides increased funding tied to greater accountability for the 30 lowest performing school districts. Over the past three years, over $125 million additional dollars have been directed to the Alliance Districts in order to help them strengthen their schools and improve outcomes for students.
"Progress in closing the achievement gap and increasing graduation rates in our state is a testament to the commitment of teachers, paraprofessionals, and all public school employees to their students," American Federation of Teachers (AFT) Connecticut President Melodie Peters said. "It's particularly important to acknowledge their work toward achieving equity and equality in public education. These latest measurements demonstrate how, despite tough odds and significant challenges, teachers are reaching students with special needs, English language learners, and those facing economic disadvantages. Educators at every level deserve recognition and the utmost respect for their tireless efforts to make a difference in the lives of their students."
"It is gratifying to learn that Connecticut's high school graduation rate continues on its upward trend. We know that students who do not graduate from high school have a low probability of leading decent and productive lives. A remarkably high percentage of the state's prison population is composed of high school dropouts," Connecticut Association of Public School Superintendents (CAPSS) Executive Director Dr. Joseph Cirasuolo said. "So, the fact that every year, more and more of our students are graduating from high school is a sign that the multiyear effort that we have been making to better engage and educate our students - an effort that has been significantly intensified over the past three years - is evidence that we are doing a better job of meeting our economic, social and moral obligation to our students."
Connecticut Education Association (CEA) President Sheila Cohen said, "We urge everyone to seize this opportunity to acknowledge the hard work and ongoing success of Connecticut students and teachers. Many of our graduates rise above very challenging circumstances with remarkable teachers behind them. If Connecticut is to build on this success, policymakers must be attentive to ensuring that teachers have the resources and time necessary to develop engaging curriculum, address the individual needs of each and every student, and provide the vital social supports that many youngsters require."
"Connecticut's news gives us reason to be optimistic. That our graduation rates are rising indicates that schools and communities at large are doing a better job of engaging our young people in learning and inspiring them to strive for the many successes in life that education can facilitate," Connecticut Association of Schools (CAS) Executive Director Karissa Niehoff said. "We are very pleased that Connecticut's overall cohort graduation rate continues to improve, and want to congratulate High School, Inc. for achieving an 18.4 percent increase in their graduation rate. It is well documented that graduation rates are uneven for students of different races, ethnicities, family incomes, disabilities, and English proficiencies. These 'graduation gaps' greatly impede progress, as students who do not graduate from high school are more likely to experience negative outcomes such as unemployment, underemployment, or incarceration."
"The Connecticut Association of Boards of Educations is pleased that the hard work of school boards, superintendents of schools, principals, teachers and others have helped to raise our graduation rates. Our students have better success in life when they graduate - and continue their education, join the military or begin a career," Connecticut Association of Boards of Education (CABE) First Vice President Ann Gruenberg said. "We need to keep building on this success for our students, our communities, our state and the nation."
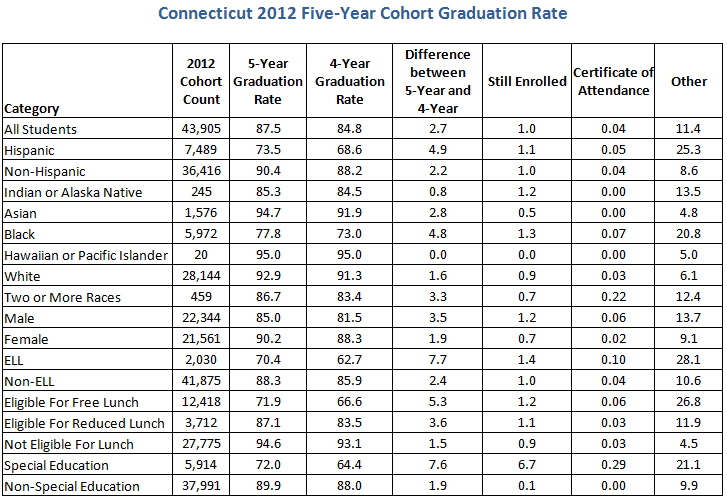
Today, the State Department of Education also released, for the first time, the five-year adjusted cohort graduation rate. The five-year grad rate illustrates that, with the benefit of an extra year, more Connecticut students earn a high school diploma. For the 2012 cohort-students who entered Grade 9 in September 2008-the overall five-year graduate rate is 87.5 percent, 2.7 percentage points higher than the cohort's four-year rate. The increases are most significant for English Language learners at 7.7 percentage points, students with disabilities at 7.6 percentage points, and those eligible for free or reduced-price lunch at 5.3 percentage points.
Graduation rates are calculated according to the Adjusted Cohort Graduation Rate method, which the National Governors Association developed and is considered to be the most precise method. These rates represent the percentage of first-time ninth-grade students who graduated with a regular high school diploma in four years or less. It is based on individual student-level data, excludes ninth-grade repeaters, late graduates, and accounts for transfers in and out of the graduating class over the four-year period.

Source: Public School Information System
Notes
:
-
With the exception of 2013 cohort count column, which is a count of students, all remaining columns represent percentages. Row percentages may not add up to 100 percent because of rounding.
-
A student is included in the ELL, special education, or free/reduced lunch subgroup, or any combination of them, if he/she was reported in that subgroup in at least one of the Public School Information System data collections over the course of his/her high school career.
-
In reporting race/ethnicity, the student's last reported category is used.
-
Special Education students who are still in school after four years but have earned the academic credits to graduate are included in the "still enrolled" column for this calculation.
-
The Cohort Count is as of the end of 2012-13 school year.
-
Four-Year Graduation Rate is the percentage of students who received a standard diploma within four years including early and summer graduates from the cohort.
-
Still Enrolled means students were still in school after four years.
-
Other category includes students who dropped out (including those who enrolled in an adult education program), OR transferred to postsecondary education, OR transferred to another school district but never enrolled in that district, OR have an unknown status.
District and School Graduation Rates
The cohort graduation rate is an important indicator in Connecticut's accountability system. The ultimate target graduation rate for schools in this accountability system is 94 percent; 76 of the 194 schools (39.2 percent) attained this target rate with the 2013 cohort.
The 2013 cohort graduation rate for students enrolled in 10 of the 30 Alliance Districts with the lowest performance (i.e., the Educational Reform Districts) was 69.1 percent (N=7,566). For students in the 20 remaining Alliance Districts, the graduation rate was 80.6 percent (N=7,365), while the rate for students in all other districts statewide was 91 percent (N=28,565).
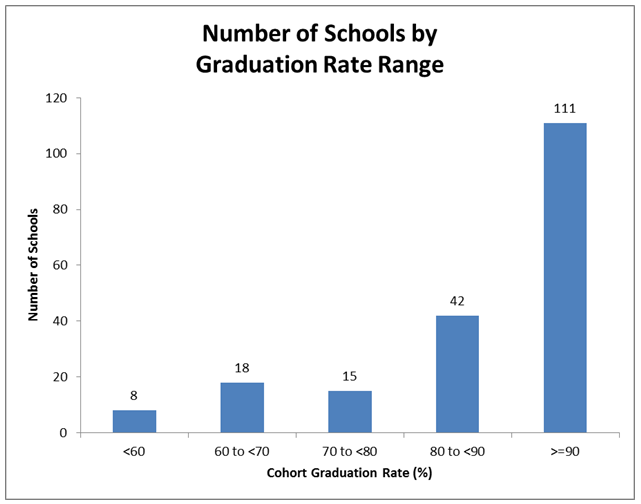
Of the 194 high schools with six or more enrolled students in the 2013 cohort, 111 (57.2 percent) schools have a graduation rate that is greater than or equal to 90 percent; 41 high schools (21.1 percent) reflect a graduation rate that is less than 80 percent.
Four-year cohort graduation rates by district and school are available at the following links:
District
|
School
Graduation Rate Gaps Among Persistently Underperforming Student Populations
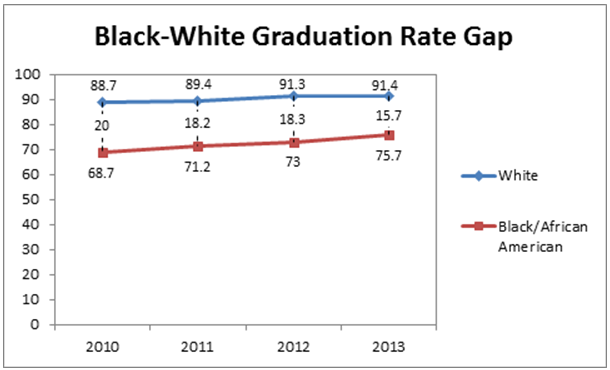
Over the last four years, the graduation rate gap between black students and white students decreased from a 20 percentage-point difference in 2010 to a 15.7 percentage-point difference in 2013-a total of 4.3 points. This represents a 21.5 percent reduction of the 2010 gap.
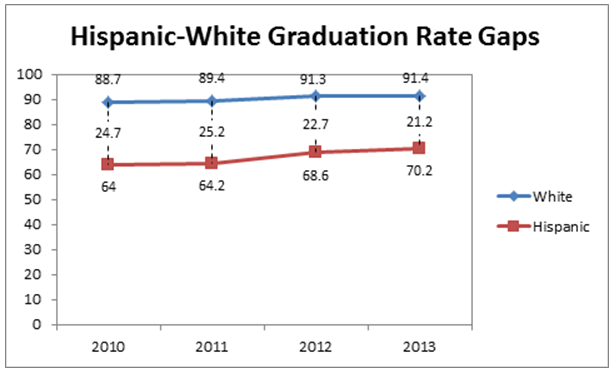
Since 2010, the graduation rate gap between Hispanic students and white students decreased from a 24.7 percentage-point difference to a 21.2 percentage-point difference for a total decrease of 3.5 points. This represents 14 percent reduction of the 2010 gap.
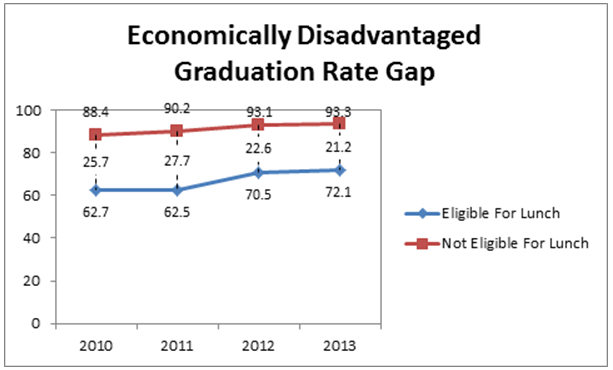
Using free and reduced-priced lunch eligibility as an indicator of family wealth, the graduation rate gap between economically disadvantaged students and their more affluent peers decreased from a 25.7 percentage-point difference in 2010 to a 21.2 percentage-point difference in 2013 for a total reduction of 4.5 points. This represents a 17.5 percent reduction of the 2010 gap.
While the increases among the graduation rates for students from subgroups are encouraging, significant gaps remain. Specifically, among black students and Hispanic students eligible for free or reduced-price lunch, there are substantial differences in graduation rates between males and females.
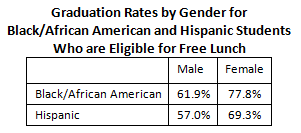
The graduation rates for our most economically disadvantaged black and Hispanic males are among the lowest graduation rates.
Non-Graduates
Of the total number of students in the cohort (43,496), 14.5 percent failed to complete high school in four years; this is down from 15.2 percent in 2012. The 14.5 percent of students who failed to graduate in four years consists of the following students:
-
still enrolled in school (5.7 percent);
-
other which includes students who dropped out (including those who enrolled in an adult education program), OR transferred to postsecondary education, OR transferred to another school district but never enrolled in that district, OR have an unknown status (8.8 percent).
About one-fifth of all students with disabilities ages 18-21 are
still enrolled
in public education though they may have completed the requirements for a high school diploma within four years. These students continue their enrollment to maintain eligibility for transition services that are designed to help them move from high school into postsecondary activities.
Of the 3,827 students in the
other
category, 1,320 (34.5 percent) had enrolled in adult education by October 2013, and 298 had earned a diploma through adult education.
Five-year cohort graduation rates by district and school are available at the following links:
District
|
School
Notes
:
-
The Cohort Count is as of the end of 2012-13 school year (from 2008 to 2013).
-
Five-Year Graduation Rate is the percentage of students who received a standard diploma within five years.
-
Still Enrolled means students were still in school after five years.
-
Certificate of Attendance credential is awarded only to students with disabilities. Less than 1 percent of students with disabilities obtained certificate of attendance.
-
Other category includes students who dropped out (including those who enrolled in an adult education program), OR transferred to postsecondary education, OR transferred to another school district but never enrolled in that district, OR have an unknown status.
Methodology and Documentation
For complete documentation regarding the cohort graduation rate, click
here
.
The Connecticut State Department of Education (CSDE) introduced the four-year cohort graduation rate with the graduating class of 2009. This approach was created when Connecticut and 49 other states signed an agreement with the National Governors' Association to develop a uniform system for tracking students. The four-year cohort graduation rate is calculated by tracking an individual cohort, or group of students, from their initial entrance into Grade 9 through to graduation. The four-year cohort graduation rate represents the percentage of students who earn a standard high school diploma within four years. The calculation uses individual student-level data from the state's Public School Information System (PSIS) that school districts submitted and superintendents certified.
###
For Immediate Release: May 14, 2014
Contact: Samaia M. Hernandez
Office of Governor Dannel P. Malloy
Samaia.Hernandez@ct.gov
860-524-7314 (office)
860-770-8298 (cell)
Office of Governor Dannel P. Malloy
Samaia.Hernandez@ct.gov
860-524-7314 (office)
860-770-8298 (cell)
Contact: Kelly Donnelly
State Department of Education
Kelly.Donnelly@ct.gov
860-713-6525 (office)
860-983-1550 (cell)
State Department of Education
Kelly.Donnelly@ct.gov
860-713-6525 (office)
860-983-1550 (cell)
Twitter:
@GovMalloyOffice
Facebook:
Office of Governor Dannel P. Malloy
- Twitter: @GovMalloyOffice
- Facebook: Office of Governor Dannel P. Malloy