
Criteria Pollutant Background Air Quality
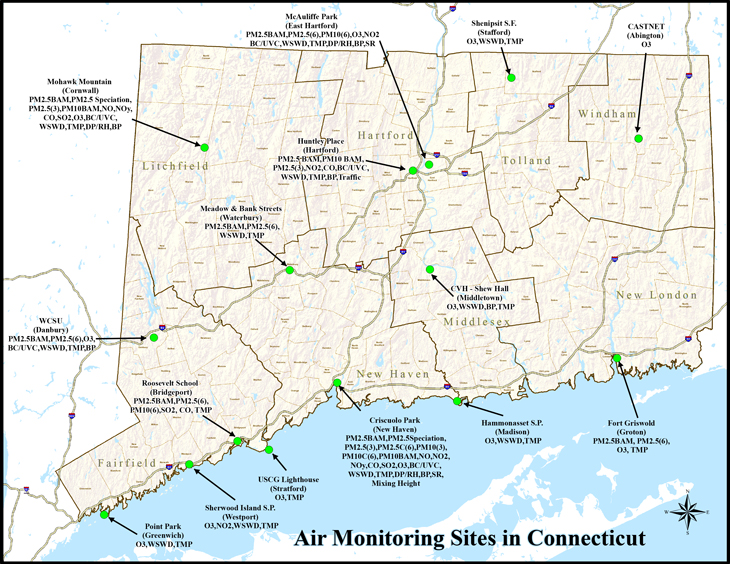
Air Monitoring Sites
Background air quality levels are added to modeled impacts to determine compliance with the NAAQS for appropriate pollutant and averaging time. Detailed procedures for estimating background concentrations from the DEEP monitoring sites are summarized in Section 6 of the Ambient Impact Analysis Guideline. The most recent three years of available design concentrations from a representative federal reference method (FRM) DEEP monitoring site located within or nearest to the modeling domain should be used to calculate background concentrations for New Source Review (NSR) modeling analyses.
The links below contain maps showing the latest NAAQS Design Values for each Criteria Pollutant subject to modeling:
1-Hour SO2 (Map)
1-Hour NO2 (Map)
Annual NO2 (Map)
24-Hour PM2.5 (Map)
Annual PM2.5 (Map)
24-Hour PM10 (Map)
8-Hour CO (Map)
1-Hour CO (Map)
Background Concentrations for the 1-Hour SO2 and NO2 NAAQS Compliance Demonstration
In 2010 the EPA finalized and promulgated new 1-hour NAAQS for SO2 and NO2. There have been several clarification memos released by EPA regarding application of Appendix W modeling guidance for the new aforementioned 1-hour standards. On March 1, 2011, EPA released a memo entitled Additional Clarification Regarding Application of Appendix W Modeling Guidance for the 1-hour NO2 NAAQS. The memo recommends that for both SO2 and NO2, use the latest three (3) year average background values that were calculated based on season and hour day. The link below contain the AERMOD formatted season by hour of day SO2 and NO2 ZIP files, based on the latest three years of monitor data.
Background Concentrations for the 24-Hour PM2.5 NAAQS Compliance Demonstration
On May 20, 2014, EPA released a memo entitled "Guidance on PM2.5 Permit Modeling". On April 17, 2018, EPA released an updated memo entitled "Guidance on Significant Impact Levels for Ozone and Fine Particulates in the Prevention Significant Deterioration Permitting Program ". The 2018 memo supersedes the 2014 memo for applying the recommended PM2.5 SIL values to determine compliance with the applicable PM2.5 NAAQS and PSD Increments. The 2014 memo is still used to calculate the two tiered approach for the latest 3-year background 24-hour and annual PM2.5 design values, and to combine modeled and monitored PM2.5 design values from a representative monitor. The table below displays the seasonal 24-hour background PM2.5 design values, based on the latest three years of monitor data in Connecticut.
| Site Name | Winter | Spring | Summer | Fall |
|
East Hartford McAuliffe Park |
19.9 | 14.1 | 15.4 | 17.0 |
| New Haven Criscuolo Park | 20.5 | 17.4 | 16.9 |
12.8 |
| Cornwall | 10.6 | 12.5 | 13.0 | 20.7 |
| Bridgeport Roosevelt School | 21.6 | 18.8 | 19.8 | 20.5 |
| Waterbury | 22.1 | 16.1 | 17.8 | 14.4 |
| Groton | 16.3 | 14.5 | 15.6 | 11.4 |
| Danbury | 25.2 | 16.6 | 16.6 | 15.8 |
Content Last Updated on September 11, 2019