
Hypoxia Maps - Summer 2002
Dissolved Oxygen Maps for Summer 2002
During the summer of 2002 the Long Island Sound Water Quality Monitoring Program modified its summertime hypoxia monitoring. The Program continues to collect samples for nutrient analysis and water quality parameters and has added phytoplankton and zooplankton sampling at six stations located throughout the Sound. Our mid July survey had an area of hypoxia larger than the average for July and our early August survey found an area below 1 mg/L that was the largest we have seen over the entire program, 42 square miles. Hypoxia was estimated to begin on or about June 26, 2002 and ended on or about August 28, 2002 for a total of 64 days with a maximum area of 130 square miles below 3.0 mg/L of dissolved oxygen.
(Select map below to link to a larger image)
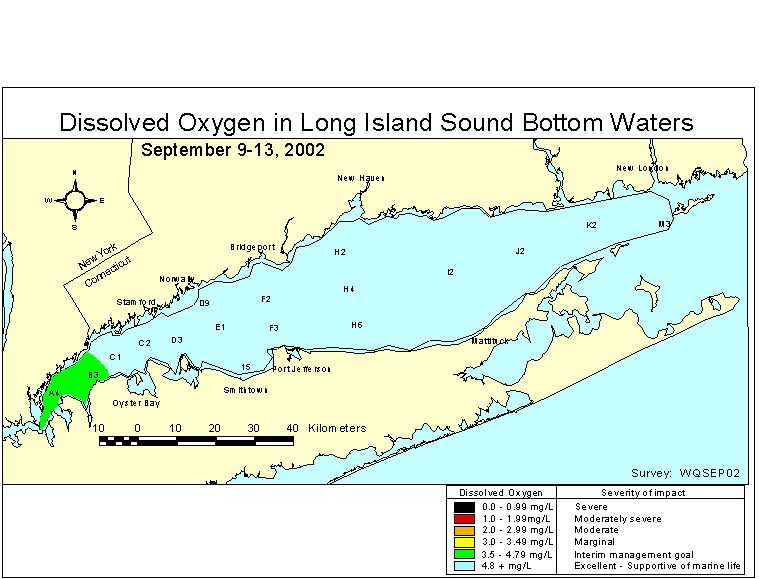 September 9-13, 2002 |
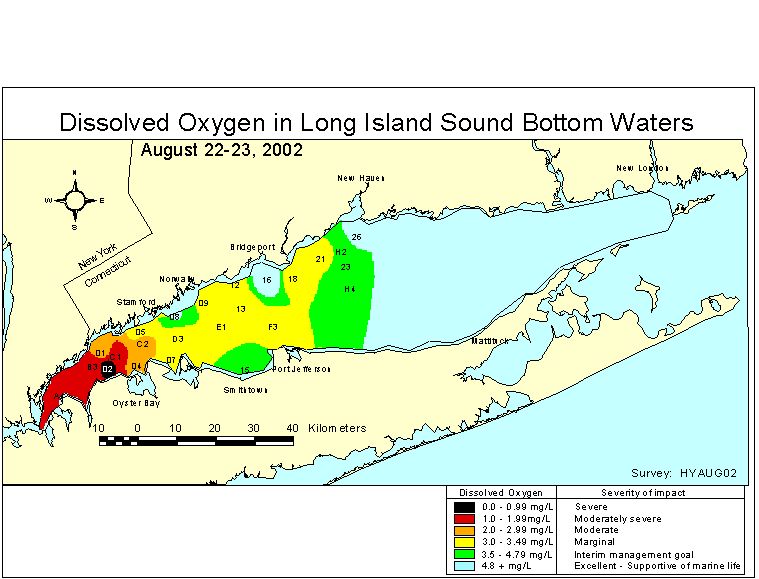 August 22-23, 2002 |
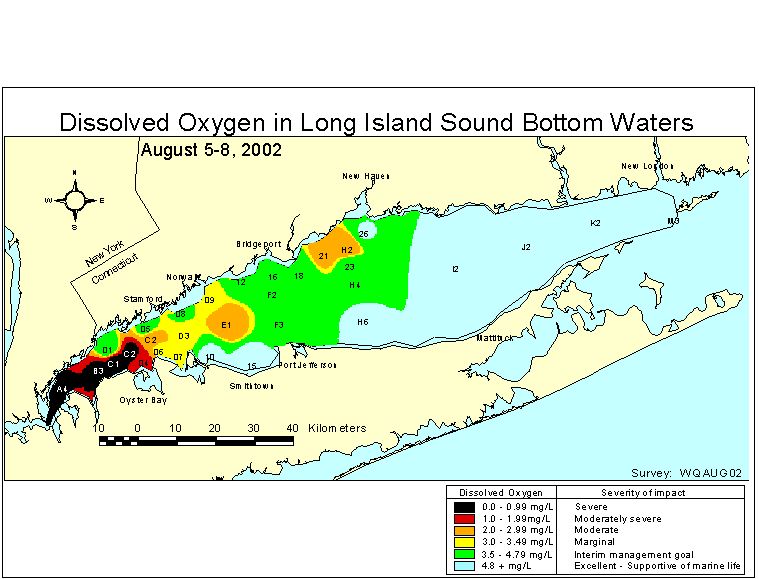 August 5-8, 2002 | |
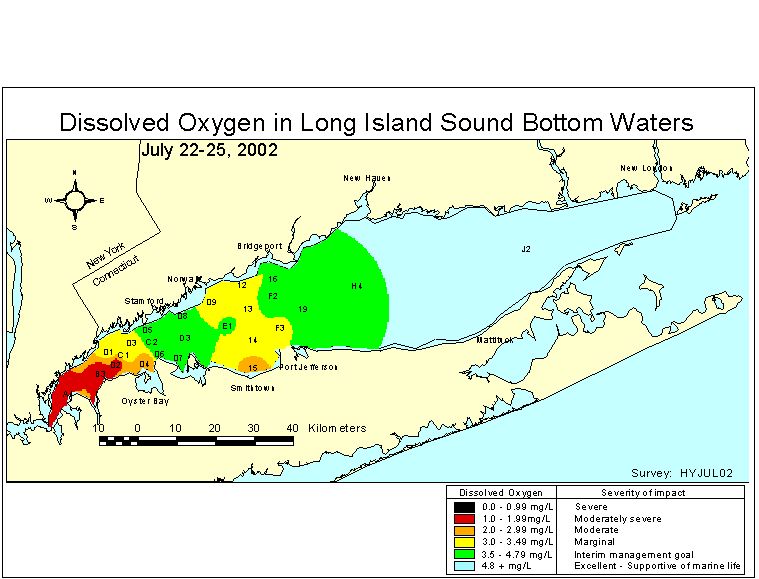 July 22-25, 2002 |
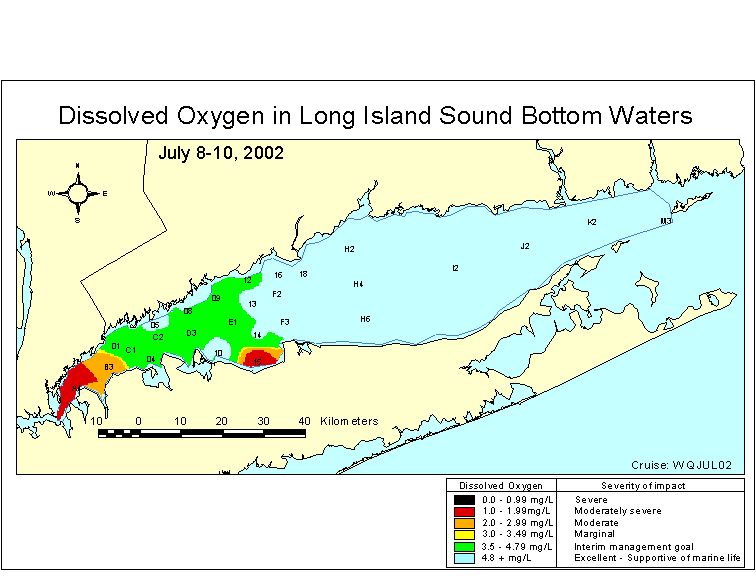 July 8-10, 2002 | ||