Instructions for this interactive tool, as well as a glossary of terms, can be found below this dashboard.
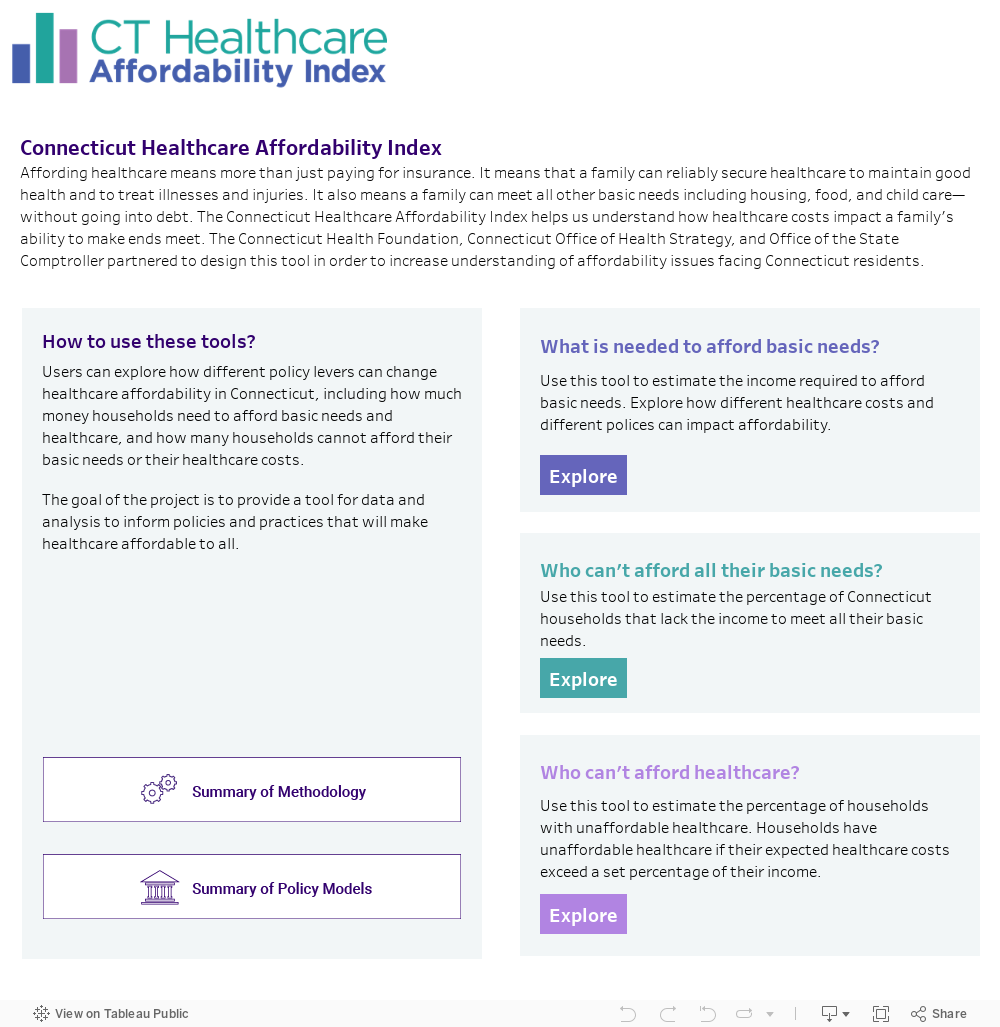
Connecticut Healthcare Affordability Index
Instructions for Using the Interactive Dashboard
The Connecticut Healthcare Affordability Index: what it is and how it works
- To use the "What is Affordable Healthcare?" dashboard
- To use the "How many households have inadequate income?" dashboard
- To use the "How many households have affordable healthcare costs?" dashboard
- Glossary of Terms
To use the "What is Affordable Healthcare?" dashboard:
Model selection:
Select one or more CHAI model(s) from the drop-down menu.
Factor selections:
Select the Healthcare cost factors of interest across the following four factors: (1) Connecticut Town, (2) Health Insurance Type, (3) Health risk score, and (4) Adult Age Range.
To view the results for “Zero Cost” health insurance, select NA from the Health risk score and the Adult Age Range menus.
Select one of the 22 Family Compositions available. Options include combinations of: (1) Adults (1 or 2), (2) Infant (0 or 1), (3) Preschooler(s) (0 or 1), (4) Schoolager(s) (0 or 1), Teenager(s) (0 or 1).
Interpreting the dashboard output:
Monthly Costs
Confirm that the Healthcare Cost Factor selections desired appear immediately below the Monthly Cost header. The Table that appears below represents the estimated monthly cost of each basic need for the Family Composition selected. Each CHAI model tests different parameters for healthcare costs or tax credits. These parameter changes may result in a different definition of an adequate income. Depending upon the factors selected, the monthly costs and basic income may be the same across CHAI models.
If you would like to save your results, select the download icon in the bottom right corner of the Tableau footer.
Continue to explore by clicking the “reset” button in the bottom right corner of the Tableau footer. Then repeat Steps 1 & 2 to explore how the income needed to meet basic needs changes across CHAI models based on selections made for the Healthcare cost factors or Family Composition factors.
To use the "How many households have inadequate income?" dashboard:
Model Selection:
Select the one or more CHAI model(s) from the drop-down menu. To view all models simultaneously select the ALL checkbox.
Factor Selections:
Select the Health Insurance Group Factors of interest across the following four options: (1) All Households, (2) Employer-sponsored, (3) Individual marketplace, and (4) Zero Cost.
Select the Demographic Group of interest.
Interpret the dashboard Output:
Income Inadequacy Rate
Confirm that the Demographic Group selection desired appears immediately beside the Income Inadequacy Rate by header at the top of the Figure. Proceed to view the Figure that appears below. Each bar represents the percentage of Income Inadequacy for the specific Demographic Group and Model(s) selected, broken down for each selected Health Insurance Group(s) of interest.
Hover your cursor on each bar for more detailed data. This includes the exact percentage of households with income inadequacy, along with the number of households with income inadequacy (N of numerator), and the total households (N of denominator) to generate the income inadequacy rate.
If you would like to save your results, select the download icon in the bottom right corner of the Tableau footer.
Continue to explore by clicking the “reset” button in the bottom right corner of the Tableau footer. Then repeat Steps 1 & 2 to change the selections made for the Model(s), Health Insurance Group(s), and Demographic Group factors in order to view the Income Inadequacy Rate for a particular demographic characteristic in each model of interest.
To use the "How many households have affordable healthcare costs?" dashboard:
Model Selection:
Select the one or more CHAI model(s) from the drop-down menu.
Factor Selections:
Select the Health Insurance Group Factors of interest across the following four options: (1) All Households, (2) Employer-sponsored, (3) Individual marketplace, and (4) Zero Cost.
Select the Demographic Group of interest.
Interpret the dashboard Output:
Households with Unaffordable Healthcare Costs
Confirm that the Demographic Group selection desired appears immediately beside the Households with Unaffordable Healthcare Costs by header at the top of the Table. Proceed to view the Figure that appears below. Each bar represents the percentage of Households with Unaffordable Healthcare Costs for the specific Demographic Group and Model(s) selected, broken down for each selected Health Insurance Group(s) of interest.
Hover your cursor on each bar for more detailed data. This includes the exact percentage of households with unaffordable healthcare costs, along with the number of families with income inadequacy (N of numerator), and total households (N of denominator) to generate the unaffordable healthcare cost rate.
If you would like to save your results, select the download icon in the bottom right corner of the Tableau footer.
Continue to explore by clicking the “reset” button in the bottom right corner of the Tableau footer. Then repeat Steps 1 & 2 to change the selections made for the Model(s), Health Insurance Group(s), and Demographic Group factors in order to explore how the breakdown of Households with Unaffordable Healthcare Costs changes with each CHAI model.
Glossary and key terms:
- Connecticut Healthcare Affordability Index (CHAI): CHAI defines what Connecticut households need in order to meet their healthcare costs without sacrificing other basic needs including housing, food, transportation, child care, and taxes. CHAI is a new measure that varies healthcare costs by factors that impact affordability including differences in insurance coverage, age, and increased out-of-pocket costs based on Health risk scores.
- American Rescue Plan Act of 2021 (ARPA): ARPA was signed into law by President Joe Biden to provide relief related to the recovery of the COVID-19 pandemic. In particular, ARPA lowers the 2021 and 2022 monthly premiums for insurance purchased on the individual marketplace by removing the income cap for the premium tax credit (PTC) as well as decreasing the percentage of income paid for the benchmark silver plan. Additionally, ARPA temporarily increases the Child Tax Credit (CTC), Earned Income Tax Credit (EITC), and the Child and Dependent Care Tax Credit (CDCTC). The increase in refundable tax credits lowers the annual income households need to meet basic needs, which in turn may put a household into a lower income bracket for the PTC subsidy percentage, increasing the total PTC the household may be eligible for.
- Covered Connecticut Program: The Covered Connecticut Program went into effect July 1st, 2021 and expands the number of Connecticut residents eligible for zero cost health insurance coverage. The Covered Connecticut Program provides zero cost health insurance through Access Health CT for parents/caregivers, and their dependents, if they are not eligible for Medicaid but are below 175% of the federal poverty guidelines. Additionally, starting after July 1st 2022, Covered Connecticut will be available for all adults with income below 175% of the federal poverty guidelines.
- Self-Sufficiency Standard: The Self-Sufficiency Standard is calculated by the University of Washington Center for Women’s Welfare and measures how much income is needed for a family of a certain composition, in a given place, to adequately meet their basic needs without public or private assistance.
- Income Adequacy: The term income inadequacy refers to an income that is too low to meet basic needs as measured by the Connecticut Healthcare Affordability Index.
Models:
- ARPA: The ARPA model replaces the tax credit parameters for the PTC, CTC, CDCTC, and EITC in the Original CHAI model with temporary changes enacted by the 2021 ARPA legislation.
- Original CHAI: The Original CHAI model provides a baseline comparison of the definition of adequate income with no policy changes.
- Covered CT (All Adults): The Covered CT (All Adults) model recategorizes households from the individual marketplace to zero cost health insurance if the household's income was between 138% and 175% of the 2019 federal poverty guidelines (2019 federal poverty guidelines were used to be consistent with household income in the American Community Survey).
- Covered CT (Caregivers): The Covered CT (Caregivers) model recategorizes households from the individual marketplace to zero cost health insurance if children were present and the household's income was between 160% and 175% of the 2019 federal poverty guidelines (2019 federal poverty guidelines were used to be consistent with household income in the American Community Survey).
Healthcare cost factors
- Town: Connecticut town
- Health insurance type: CHAI is calculated for three types of health insurance coverage. Health insurance type is applied to a household based on the coverage of the householder.
- Employer-Sponsored: The cost of employer-sponsored health insurance premiums is calculated based on data from the Medical Expenditure Panel Survey. Households are categorized as employer-sponsored in the American Community Survey dataset if the householder has insurance through a current or former employer or union, or TRICARE or other military healthcare.
- Individual marketplace: The cost of individual marketplace health insurance premiums is based on the Choice Silver Standard POS plan, the most common plan purchased through Access Health CT, the individual marketplace in Connecticut under the Affordable Care Act. Households are assigned to the individual marketplace category in the American Community Survey dataset if the householder purchased insurance directly from an insurance company or if the householder was uninsured (or only had Indiana Health Service insurance) and is not income eligible for Medicaid.
- Zero cost: The zero cost health insurance category reflects the cost of having zero healthcare related expenses. Households are assigned to the zero cost category in the American Community Survey dataset if the householder has no cost health insurance such as through Medicaid or any kind of government-assistance plan for those with low incomes or a disability; VA (including those who have ever used or enrolled for VA healthcare); Indian Health Service along with income eligibility for Medicaid; Uninsured along with income eligibility for Medicaid; Medicare under 65; or the Covered Connecticut Program.
- All households: The all households category shows the total results for Connecticut households, regardless of health insurance type.
- Health risk score: Out-of-pocket costs for households with employer-sponsored or individual marketplace insurance are varied based on the Health risk score of the householder. A Health risk score of low indicates good health; a Health risk score of medium signifies chronic diseases that are controlled; and a Health risk score of high indicates chronic diseases that are uncontrolled or have related complications. The 3M™ Health Information Systems statistical scoring methodology was utilized to stratify patients into these three categories to calculate the out-of-pocket-costs through predictive modeling. Households are assigned to a Health risk score category based on matching the distributions derived from UCONN AIMS claims data by county, sex, gender, and age category with that of the householder.
- Adult age ranges: Out-of-pocket costs and individual marketplace premiums vary based on age. To account for these cost differences, CHAI healthcare costs are varied based on the age of the householder (18-34, 35-49, or 50-64).
Cost of basic needs
- Housing: The monthly cost of housing reflects the cost of rent and utilities at the 40th percentile of rental units that meets the basic standard of decency as defined by the U.S. Department of Housing and Urban Development (HUD).
- Child Care: The monthly cost of child care assumes market-rate costs (defined as the 75th percentile) by facility type, age of children, and geographical location. The Standard assumes infants (children 0 to 2 years old) and preschoolers (children 3 to 5 years old) are assumed to be in full-time care. Costs for school age children (6 to 12 years old) assume they receive before and after school care.
- Food: The Standard uses the U.S. Department of Agriculture Low-Cost Food Plan for food costs. The Low-Cost Food Plan was designed to meet minimum nutritional standards using realistic assumptions about food preparation time and consumption and does not allow for any take-out, fast-food, or restaurant meals. Geographical differences in food costs are calculated using data from Map the Meal Gap, published by Feeding America.
- Health Care: CHAI replaces the Self-Sufficiency Standard healthcare cost with detailed calculations based on health insurance type, Health risk score, and adult age range (see Healthcare cost factors above).
- Transportation: Public transportation costs are assumed in towns if 7% or more of workers use public transportation to get to and from work. Otherwise, transportation costs assume the expense of owning and operating a car utilizing data from the American Automobile Association, the National Household Travel Survey, National Association of Insurance Commissioners, and the Consumer Expenditure Survey. Travel is limited to commuting to work and day care plus one shopping trip per week.
- Miscellaneous: Miscellaneous expenses are calculated by taking 10% of all other costs. This expense category consists of all other essentials including clothing, shoes, paper products, diapers, nonprescription medicines, cleaning products, household items, personal hygiene items, and telephone service.
- Taxes: Taxes include federal income tax and payroll taxes, as well as state income tax, state tax credits, and state sales tax.
- Child Tax Credit (-): The Child Tax Credit includes the monthly equivalent of the federal Child Tax Credit.
- Child Care Tax Credit (-): The Child and Dependent Care Tax Credit includes the monthly equivalent of the federal Child and Dependent Care Tax Credit.
- Earned Income Tax Credit (-): The Earned Income Tax Credit includes the monthly equivalent of the federal Earned Income Tax Credit.
- Premium Tax Credit (-): Individuals and households with insurance purchased through the Health Insurance Marketplace (Access Health CT) may be eligible for the premium tax credit to lower the cost of their health insurance premium.
- Annual Income: Monthly income multiplied by 12 months.
- Monthly Income: Total monthly income needed to meet basic needs.
- Hourly Wage (per adult): The hourly wage assumes full time employment for each adult and is calculated by dividing the monthly income by 176 hours for one adult or 352 hours for two adult households.
- Emergency Savings: The emergency savings reflects the amount needed to cover living expenses when there is job loss net of the amount expected to be received in unemployment benefits.
Demographic groups
| Group | Total |
|---|---|
|
County |
Fairfield ; Hartford ; Litchfield ; Middlesex ; New Haven ; New London ; Tolland ; Windham |
|
Educational attainment of householder |
Less than high school; high school graduate; some college; college graduate and above |
|
English speaking ability of householder |
Less than very well ; Very well |
|
Family Type |
No children ; Married with children ; Single father ; Single mother |
|
Food Stamp/SNAP |
No ; Yes |
|
Gender of householder |
Men ; Women |
|
Health insurance status of householder |
No health insurance coverage ; With health insurance coverage |
|
Health risk score |
Each household is assigned to low, medium, or high based on distributions derived from UCONN AIMS claims data by county, sex, gender, and age category of the householder |
|
Household language |
Asian and Pacific Island language ; English only ; Other Indo-European language ; Other language ; Spanish |
|
Housing burden severe |
Housing costs <= 30% of income ; Housing costs > 30 % and <= 50% of income ; Housing costs > 50% of income ; no cash rent |
|
Income compared to CHAI threshold |
Above CHAI ; Below CHAI Note that every household in the American Community Survey is assigned a CHAI income threshold that varies based the town, family composition, health insurance type, Health risk score, and adult age group. The CHAI income threshold may vary based on the CHAI model selected. |
|
Marital status of householder |
Divorced ; Married ; Never married ; Separated ; Widowed |
|
Public assistance |
No ; Yes |
|
Race/ethnicity of householder |
American Indian or Alaska Native ; Asian, Native Hawaiian, and Other Pacific Islander; Black or African American ; Latinx ; Other Race, Two or More Races ; White |
|
Spending Target Family Code |
1 Adult 0 Children ; 1 Adult 1 Child ; 1 Adult 2 Children ; 1 Adult 3 Children ; 1 Adult 4 Children ; 1 Adult 5 Children ; 1 Adult 6 Children ; 2 Adult 0 Children ; 2 Adult 1 Child ; 2 Adult 2 Children ; 2 Adult 3 Children ; 2 Adult 4 Children ; 2 Adult 5 Children ; 2 Adult 6 Children |
|
Tenure |
No cash rent ; Owner ; Renter |
|
Work Status of Householder |
Full time/part year; full time/year round; Part time/part year; Part time/year round ; Not working |