Connecticut Community Health Centers (CHCs) serve as the medical home and family physician to many of Connecticut’s most vulnerable populations—a number that is quickly growing.
In 2006, Connecticut Community Health Centers served:
-
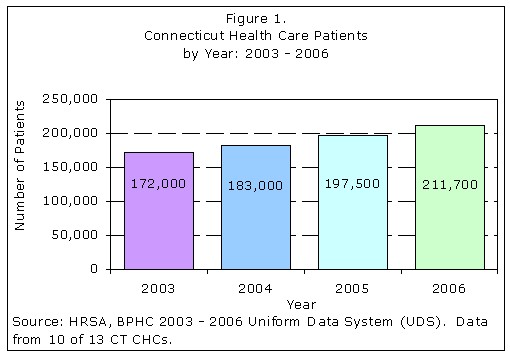
211,693 total patients
-
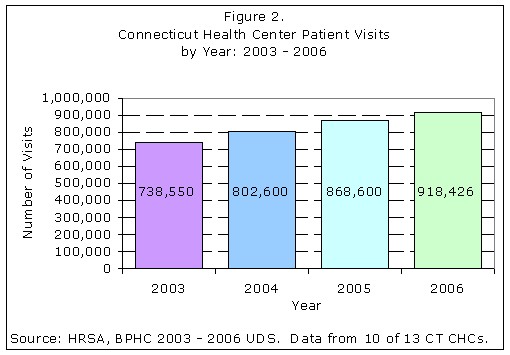
918,426 total patient visits
-
17,154 Homeless patients
-
85,698 patients preferred to be served in languages other than English
-
8,887 infants (under age 2)
-
3,469 prenatal care patients
-
58,901 women of childbearing age (ages 15 – 44)
Note:
Federally –funded Federally- Qualified Health Centers (FQHCs) meet federal health center grant requirements and are required to report administrative, clinical and other information to the federal Bureau of Primary Health Care, HRSA. The FQHC data is compiled into a report: The Uniform Data System Rollups. In CT, there are currently 10 FQHCs. Other health centers known as “FQHC Look Alikes” do not receive federal health center grant funds and do not report to the Bureau of Primary Health Care. Currently, there are 3 FQHC Look Alikes in CT. Their data is not included in this CHC data report. Future DPH CHC reports will include FQHC Look Alike data.
Community Health Centers serve a patient population whose numbers are increasing yearly. The number of patients seen at Health Centers has increased by 23% since 2003 and the number of patient visits has increased by 24% (Figure 1). In 2006, over 210,000 Connecticut residents sought needed medical, dental and mental health services at CT CHCs, generating over 900,000 patient visits (Figure 2). Over 1,510 physicians, nurse practitioners, psychiatrists, nurses, certified nurse midwives, dentists, dental hygienists, and other personnel comprised the care and support teams that served these patients.
Total CHC Patient Visits by Year
Number of Serives Delivered by Year
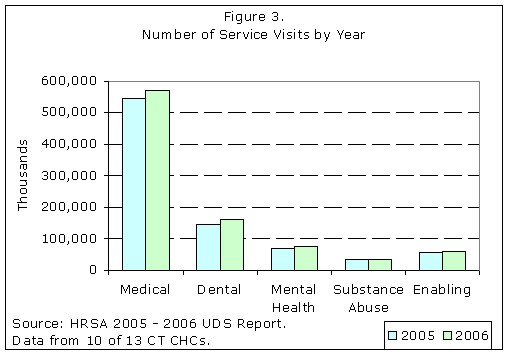
In 2006, Community Health Centers provided almost one million service visits. As indicated in Figure 3, of the total visits in 2006, 62% were for medical, 17% for dental, 12% for mental health/substance abuse and 7% for enabling services such, as case management, transportation, outreach, patient and community education, and translation.
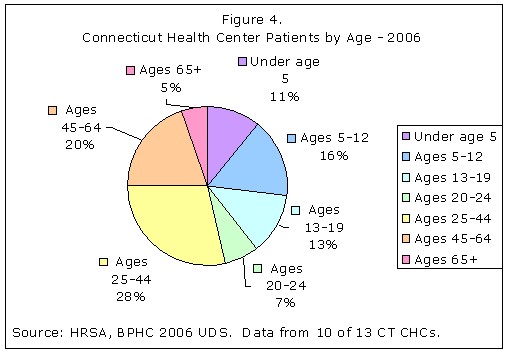
As identified in Figure 4, 35% of the patients who seek care at Community Health Centers are between ages 20 and 44. Children under age 5 represent 6 % of Connecticut’s population. Yet, this age group represents 11% of the patients who receive primary care at CT CHCs. Conversely, Geriatric patients (over age 65) represent 12.4% of CT’s population, yet only 5% receive health care at a CHC. Care for Women’s health issues (ages 15-44) represents 28% of the CT CHC population.
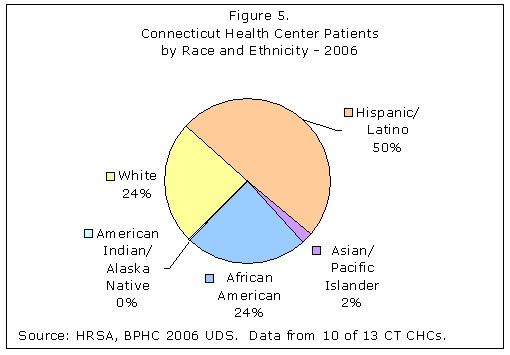
The US Census Bureau estimated Connecticut’s population in 2005 at 3,504,809. Hispanic/Latino persons accounted for 11% of the total. As identified in Figure 5, 50 % of the patients receiving care at CT CHCs register as Hispanic/Latino. African Americans comprise 9.5% of Connecticut’s population, but 24% of the patient population at CT CHCs.
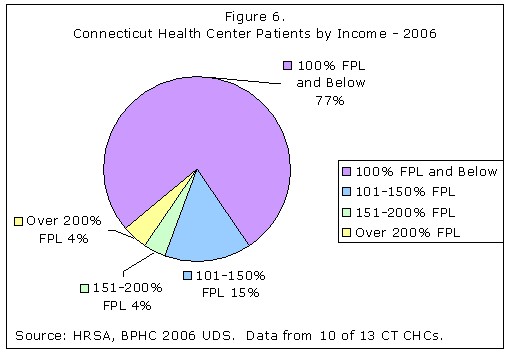
As indicated in Figure 6, 76% of the patients who receive care at a CT CHC have incomes of 100 percent or less of the federal poverty level (FPL), compared to 8% of CT residents (2006 data) with incomes 100% or below the federal poverty level.
Use of Federal Poverty Level Guidelines (FPL)
Family income and the federal poverty guidelines are used to determine financial eligibility for various federal and state funded programs. The Dept. of Health & Human Services (HHS) publishes the guidelines in February of each year in the Federal Register. Table 1. identifies the Federal Poverty Guidelines for years 2002 through 2007. As indicated, in 2006, a family income of $20,000 for a family of four equals 100 percent of the FPL guidelines.
|
Table 1.
Federal Poverty Level Guidelines
2002-2007 | ||||
|
Year |
First Person |
Each Additional Person |
Three-Person Family |
Four-Person Family |
|
2008 |
$10,400.00 | $3,600.00 | $17,600.00 | $21.200.00 |
| 2007 | $10,210.00 | $3,480.00 | $17,170.00 | $20,650.00 |
| 2006 | $9,800.00 | $3,400.00 | $16,600.00 | $20,000.00 |
| 2005 | $9,570.00 | $3,260.00 | $16,090.00 | $19,350.00 |
| 2004 | $9,310.00 | $3,180.00 | $15,670.00 | $18,850.00 |
| 2003 | $8,980.00 | $3,140.00 | $15,260.00 | $18,400.00 |
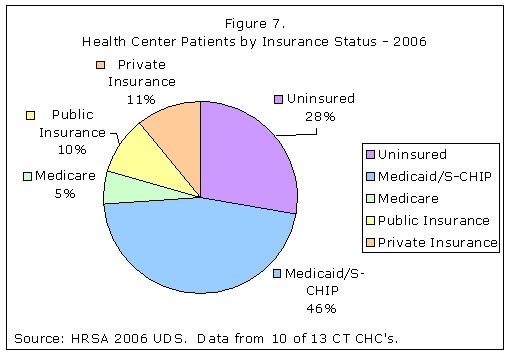
The insurance status of patients receiving services at Connecticut CHCs during 2006 is provided in Figure 7. As shown, 28% of health center patients are uninsured and another 46% depend on Medicaid.
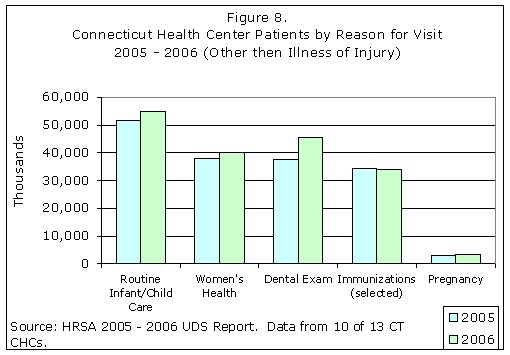
Patients by Primary Reason for Visit other than Illness or Injury
The principal reason for visiting the Health Centers continues to be traditional primary care and dental services. As indicated in Figure 8, in 2006, the Health Centers provided more than 54,000 well-child services, over 45,000 dental exams, more than 40,000 women’s health services and 3,469 obstetric services. In 2006, the number of patients seen at Health Centers for medical visits increased by 7%, whereas the number of patients seen for a dental visit increased by almost 10%.
For more information on Dental Services in CHCs, please link to the DPH: Oral Health Services webpage: http://www.ct.gov/dph/cwp/view.asp?a=3115&q=387268&dphNav_GID=1601
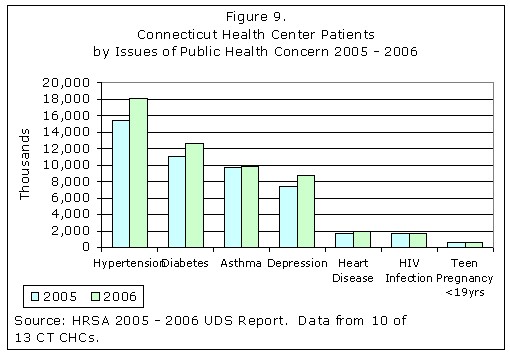
Patients by Issues of Public Health Concern
As indicated in Figure 9, more than 51,000 patients were treated for hypertension, diabetes, asthma, depression, heart disease and HIV infection -- all health issues of public concern. The USA Dept. of Health & Human Services has developed a national health agenda and set forth the following indicators for “Health People 2010”: Physical Activity, Overweight & Obesity, Tobacco Use, Substance Abuse, Responsible Sexual Behavior, Mental Health, Injury & Violence, Environmental Quality, Immunizations, Access to Health Care. The Community Health Centers treat many thousands of individuals with health problems that are associated with the Healthy People 2010 agenda.
For more information on the Healthy People 2010 agenda, please link to the US Dept HHS, HealthyPeople 2010 webpage: http://www.healthypeople.gov
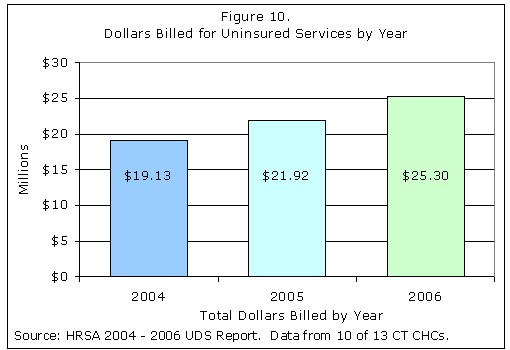
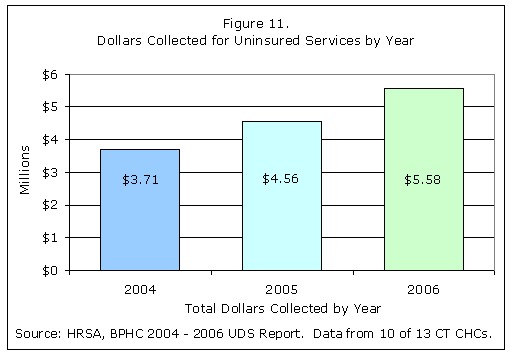
The total billed charges, as shown in Figure 10, is the total sum of those services delivered to patients who were uninsured at the time of a given visit. In 2006, $25.3 million were billed for services delivered to the uninsured. According to the UDS data submitted for 2006, the CT federally qualified health centers collected approximately twenty cents for every dollar they billed to the uninsured (Figure 11).
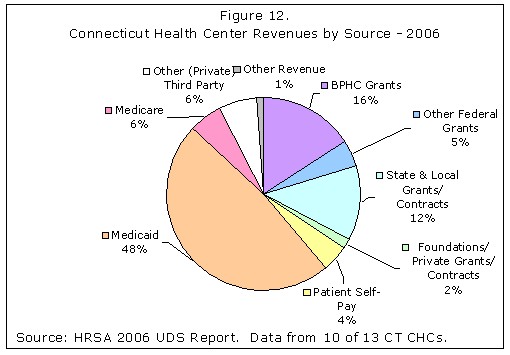
Health Center Revenues by Source
As indicated in Figure 12, of the total revenues generated by CT Health Centers in 2006, Federal grants represented 21%, exceeded only by reimbursements from Medicaid which represents over 48% of the total revenues.
Fact Sheet about Connecticut Community Health Centers
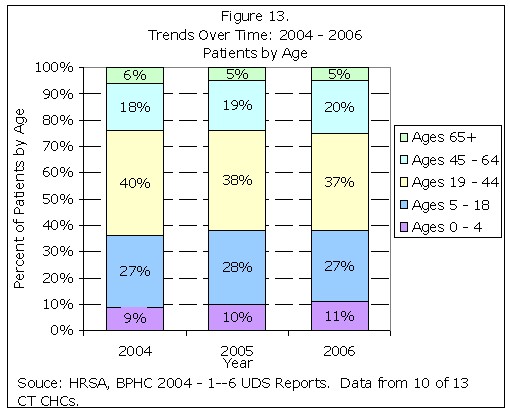
Trends Over Time: 2004-2006 Patients by Age
The number of patients seen at Health Centers increased by 16% since 2004. By age group, the proportion of patients has remained constant as seen in Figure 13. The single largest group seeking care at the Health Centers is patients between the ages of 25 - 44.
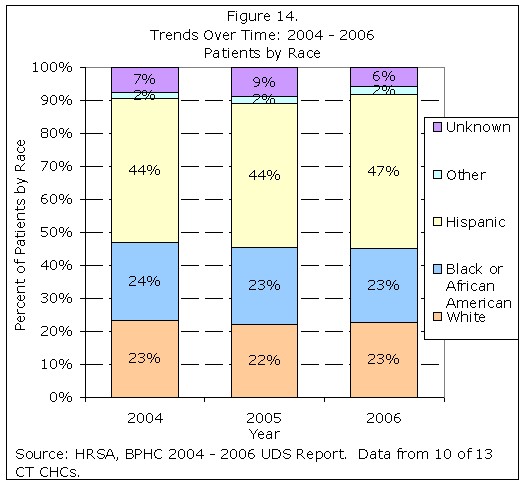
Trends Over Time: 2004-2006 Patients by Race
Over the time period from 2004-2006, the proportion of Hispanic patients increased from 44% to 47% (Figure 14). The actual number of Hispanic patients rose by more than 19,000. This represents an increase of 24% from 2004. During the same time period, the number of Black patients rose by 10% and White patients by 13%.
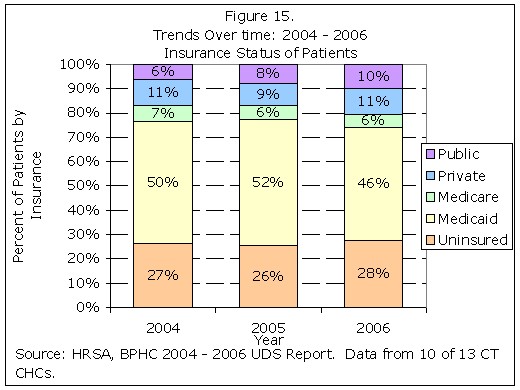
Trends Over Time: 2004-2006 Patients by Insurance Status
Since 2004, the proportion of patients without insurance has increased while the proportion of patients on Medicaid has decreased (Figure 15). More than 58,000 Health Center patients were uninsured for all or part of 2006, an increase of over 10,250 patients or 21%.
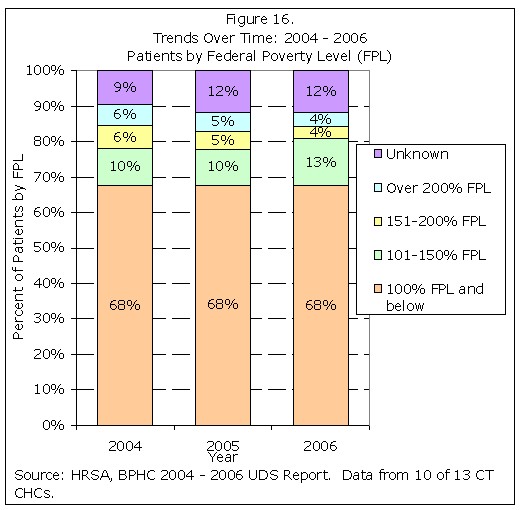
Trends Over Time: 2004-2006 Patients by federal Poverty Level
Since 2004, the proportion of patients living with a family income level at or below 100% of the Federal Poverty Level ($20,000 for a family of four in 2006) has remained constant (figure 16).